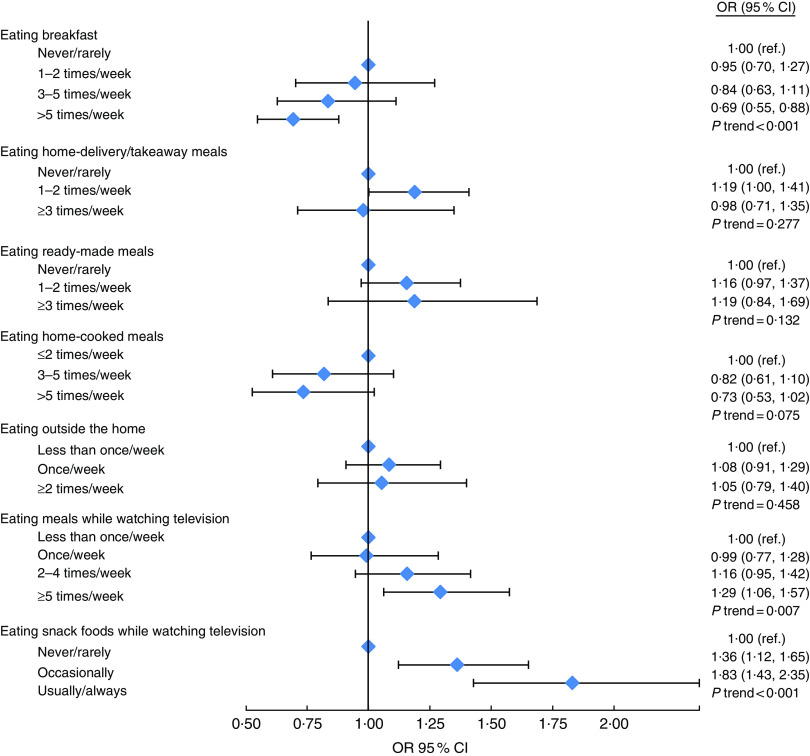
Fig. 2.
Associations of dietary habits with daily consumption of artificially sweetened beverages among adults (n 9991) aged 30–64 years in the Fenland Study, Cambridgeshire, UK, 2005–2013. OR ( ) and 95 % CI (represented by horizontal bars) were adjusted for demographic and socio-economic factors and mutually adjusted for different dietary habits presented here (ref., reference category)

