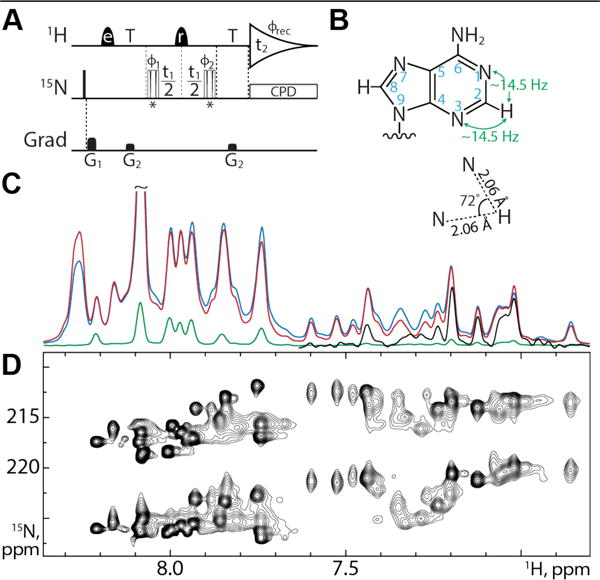
Figure 1.

(A) VF-HMQC pulse sequence for measurement of 2DNH in adenine bases. Narrow bars represent 90° pulses, while half-ellipsoids denote shaped 1H pulses, e and r representing EBURP2 and ReBURP pulses respectively1. 15N pulses marked * are BIR-4 pulses2 designed for either 90° or 45° flip angles, applied in an interleaved manner. 1H shaped pulses have a duration of 2.8 ms (EBURP) and 3 ms (ReBURP) at 600 MHz and are centered at 7.4 ppm. 15N pulses are applied at 220 ppm. All pulses have phase x unless otherwise indicated. The delay T is set to 1/3JNH (22.73 ms). Phase cycling: ϕ1 = x,−x, ϕ2 = x,x,−x,−x, ϕrec = x,−x,−x,x. Gradient pulses G1,2 = 5.8, 3.75 G/cm with durations of 1 ms. All gradient pulses are smoothened rectangular shapes. Quadrature detection is achieved using the STATES-TPPI method with ϕ1 incremented by 90° for each FID4. Composite pulse decoupling is achieved using the GARP sequence8. (B) Adenine geometry. Magnetization is transferred via the two-bond coupling between H2 and N1/N3 as indicated. The relative angle between the H2-N1 and H2-N3 inter-nuclear vectors is 72°. (C) VF-HMQC with 90° flip (red), SOFAST-HMQC13–14 (blue) and S3E25 (green) experiments recorded on the 232 nucleotide RRE232A without 15N chemical shift evolution shows the increase in sensitivity of our approach. The upfield region of the S3E experiment is scaled up by 10 times in black. (D) VF-HMQC spectrum of RRE232A showing H2-N1 and H2-N3 correlations.
