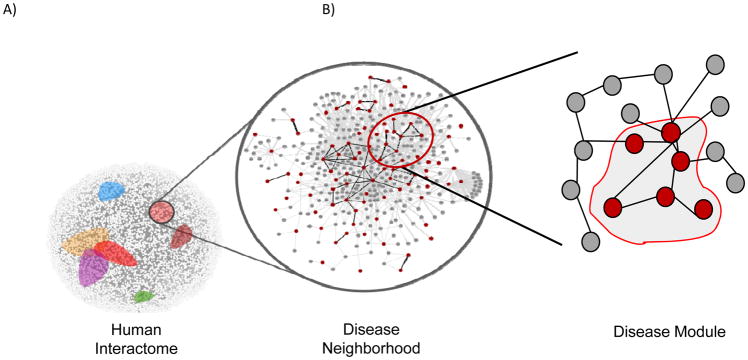
Figure 3. Molecular interaction networks (“interactome”).
The protein-protein interactome describes interactions between proteins in a scale-free (i.e., interactions are not random but clustered) manner. Within the interactome, groups of proteins reside in disease neighborhoods (colored areas) that may overlap indicating common mediators (left, center). Within the neighborhood, there are a number of disease modules, or groups of protein interactions that are related. Analysis of the interactome may uncover new or previously unrecognized relationships. Gray circles, nodes (i.e., proteins in a protein-protein interaction network); black lines, edges (i.e., interactions).

