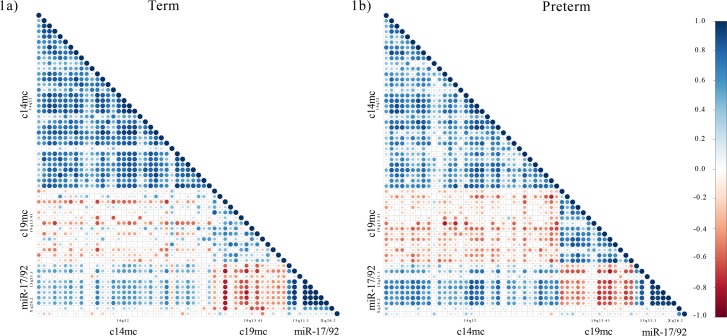
Fig 1. Correlations plots of individual miRNAs (-∆CTs) from clusters c14mc, c19mc, and miR-17/92.
Individual miRNAs were grouped according to cluster and ordered within according to genomic position clusters. Pearson’s correlation analysis was performed for individual miRNAs -∆CTs for term (A) and preterm (B) separately. Positive and negative Pearson’s r coefficients are represented by blue and red dots, respectively.

