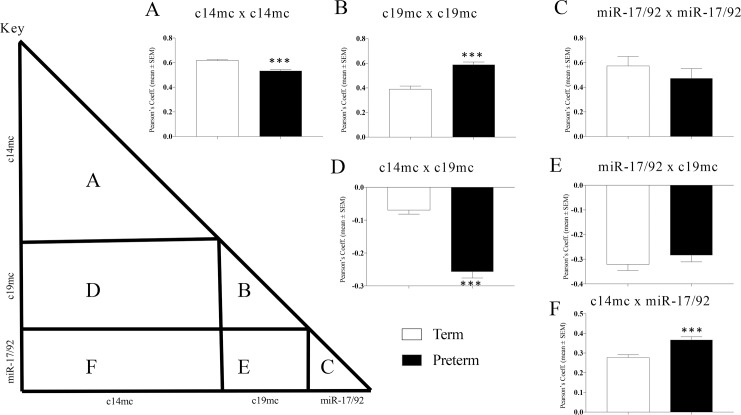
Fig 2. miRNA correlation comparisons between PTB and term cases.
Average correlations between individual miRNAs were compared between term and PTB to evaluate differences in coordinated expression of miRNA clusters c14mc, c19mc, and miR-17/92. Regions of each respective term and PTB correlation matrices that corresponded to within cluster correlations (A-C) and between clusters correlations (D-F) were compared by ANOVA (Fig 2 key provides a visual guide for which areas of the matrices were compared between term and PTB). (A) PTB showed lower correlated expression of c14mc miRNAs and (B) higher correlated expression of c19mc miRNAs. (C) Within cluster correlations for miR-17/92 miRNAs did not differ between term and PTB. (D) Negative correlations between c14mc and c19mc miRNAs was stronger in PTB, while (E) the negative correlations between miR-17/92 and c19mc miRNAs did not differ between term and PTB. (F) PTB showed stronger correlations between c14mc and miR-17/92 miRNAs. Correlations were calculated using Pearson’s correlation coefficient. *** = p<0.001; ANOVA.

