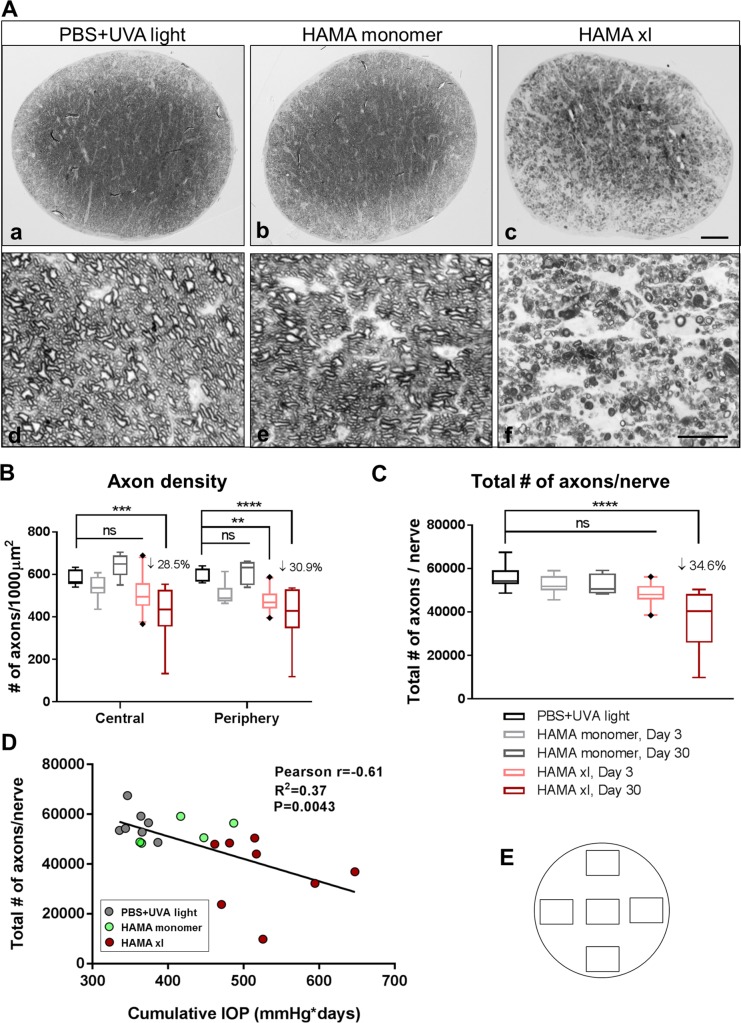
Fig 3. Ocular hypertension induced by HAMA xl led to significant degeneration of axons in the optic nerves one month post-injection.
(A) Representative graphs of semi-thin optic nerve cross sections from Day 30 samples stained with paraphenylenediamine (PPD) at 200x (upper panels) and 1,000x (lower panels) magnifications. Scale bar in c: 50 μm; Scale bar in f: 10 μm. (B) Quantification of axon density in the central and periphery regions (refer to S2 Fig for technical details). (C) Quantification of total axon number per optic nerve. Graphs were shown as interleaved box & whiskers with 95% confidence interval. n = 5–8 eyes/group, ** P = 0.0031, *** P = 0.0002, **** P<0.0001. Statistical analyses were performed using Two-way (B) and One-way (C) ANOVA followed by Tukey’s multiple comparisons test (F = 6.808, P<0.0001). (D) Pearson’s correlation coefficient analysis of the association between total axon number and cumulative IOP on Day 30. P<0.01. The extent of axon loss appeared to be associated with cumulative IOP. (E) Schematic indicating five 110 μm x 82 μm rectangle area at the optic nerve cross section sampled for axon quantification (refer to S2 Fig for technical details).

