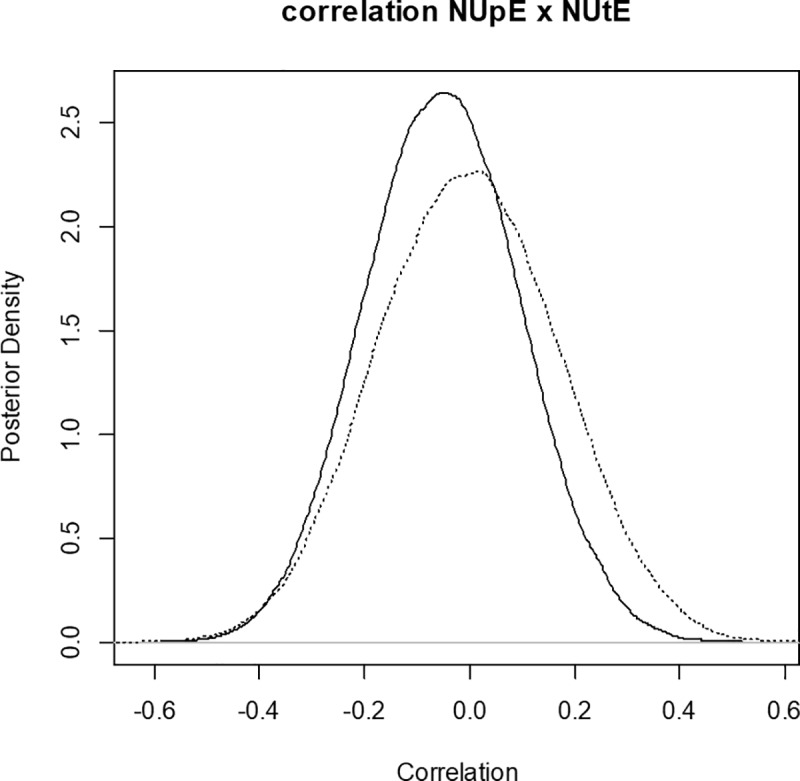
Fig 2. Posterior density for the genotypic correlation between the traits nitrogen-uptake efficiency (NUpE) and nitrogen-utilization efficiency (NUtE) for the multi-trait multi-environment model.

The solid line represents the posterior density for the HN level, while the dotted line represents the posterior density for the LN level.
