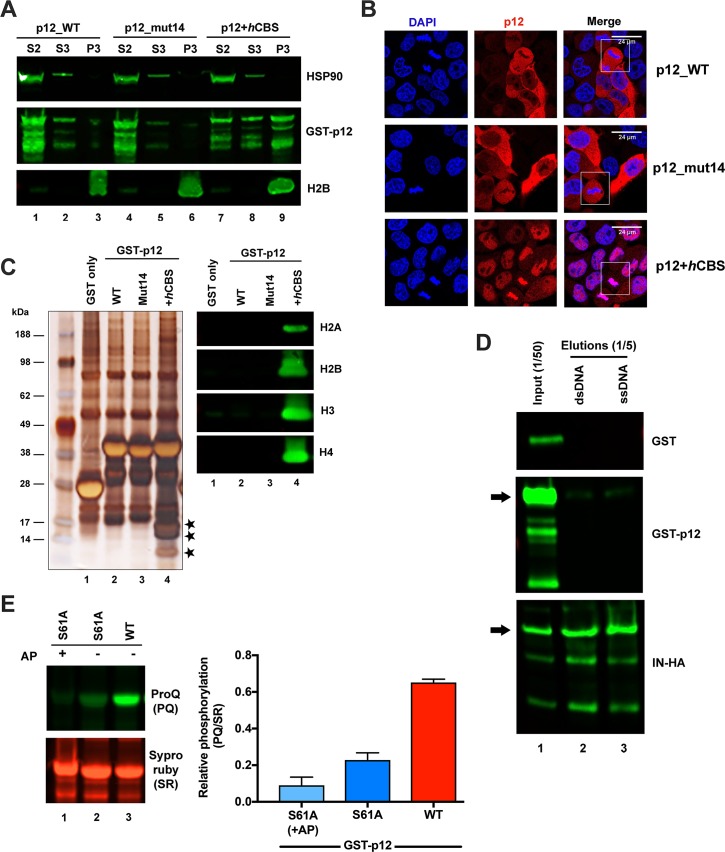
Fig 3. Recombinant GST-Mo-MLV p12 does not associate with mitotic chromatin but is phosphorylated.
(A) A representative immunoblot showing subcellular distribution of GST-p12. GST-tagged Mo-MLV p12_WT (lanes 1–3), p12_mut14 (lanes 4–6) and p12+hCBS (lanes 7–9) were expressed in 293T cells for ~40 h. Cells were then subjected to biochemical fractionation and equivalent amounts of fractions S2-cytosolic (lanes 1, 4 and 7), S3-soluble nuclear (lanes 2, 5 and 8) and P3-chromatin pellet (lanes 3, 6 and 9) were analysed by SDS-PAGE and immunoblotting with anti-p12, anti-HSP90 (cytosolic marker) and anti-H2B (chromatin marker) antibodies. (B) Representative confocal microscopy images showing GST-p12 localisation in HeLa cells stably transduced with constructs expressing GST-tagged Mo-MLV p12_WT, p12_mut14 or p12+hCBS. Cells were stained for p12 (anti-p12, red) and DNA (DAPI, blue). White boxes indicate mitotic cells. (C) Representative silver-stained SDS-PAGE gel (left) and immunoblot (right) of GST-p12 complexes. 293T cells were transiently-transfected with expression constructs for GST-tagged Mo-MLV p12_WT (lane 2), p12_mut14 (lane 3) or p12+hCBS (lane 4), or GST alone (lane 1). 24 h post-transfection, cells were treated with nocodazole overnight to arrest them in mitosis and then lysed. Cell lysates were normalised on total protein concentration and GST-p12 protein complexes were precipitated with glutathione-sepharose beads. Bead eluates were analysed by SDS-PAGE followed by silver-staining or immunoblotting with anti-H2A, anti-H2B, anti-H3 or anti-H4 antibodies. Bands corresponding to core histones in the silver-stained gel are starred. (D) Immunoblot showing DNA pull down assays. 293T cells were transiently-transfected with expression constructs for GST alone (top panel), GST-tagged Mo-MLV p12_WT (middle panel), or IN-HA (bottom panel) for ~40 h. DNA interacting proteins were precipitated from normalised cell lysates with cellulose beads coated with double stranded (lane 2) or single-stranded (lane 3) calf thymus DNA, and analysed by immunoblotting with anti-GST, anti-p12, or anti-IN antibodies, respectively. The arrows indicate full-length GST-p12 (~38 kDa) and IN-HA (~49 kDa) bands in the western blots. (E) GST-p12 phosphorylation. Normalised, mitotic cell lysates expressing GST-tagged Mo-MLV p12_WT (lane 3) or p12_S61A (lanes 1 and 2) were incubated with glutathione-sepharose beads. Bound proteins were separated by SDS-PAGE and the gel was sequentially stained with ProQ diamond (PQ, specifically stains phosphorylated proteins) and Sypro ruby (SR, stains all proteins) dyes. Prior to SDS-PAGE, one p12_S61A sample was treated with alkaline phosphatase (AP) for 1 h at 37°C. Band intensities were measured using a ChemiDoc imaging system and the bar chart shows PQ/SR ratios, plotted as mean ± SD of 3 technical replicates.

