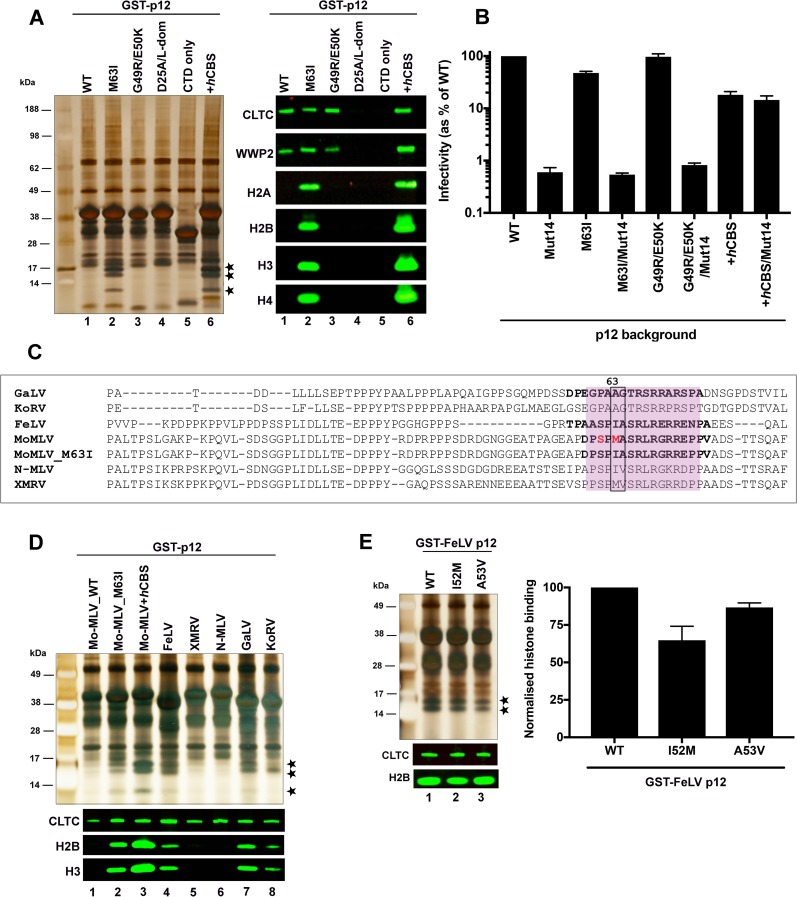
Fig 5. GST-Mo-MLV p12_M63I and other p12 orthologs associate with mitotic chromatin.
(A) Representative silver stained gel (left) and immunoblot (right) showing binding of a panel of GST-p12 mutants to host proteins. 293T cells were transiently-transfected with expression constructs for GST-tagged Mo-MLV p12_WT (lane 1) and a panel of Mo-MLV p12 mutants: M63I (lane 2), G49R/E50K (lane 3), D25A/L-dom (carrying alanine substitutions of the PPPY motif as well as D25A, which disrupts clathrin binding, lane 4), p12 CTD only (lane 5) or GST-p12+hCBS (positive control, lane 6) for ~24 h before being treated overnight with nocodazole. GST-p12 protein complexes were precipitated from normalised cell lysates with glutathione-sepharose beads and analysed by SDS-PAGE followed by silver-staining or immunoblotting with anti-CLTC, anti-WWP2, anti-H2A, anti-H2B, anti-H3 and anti-H4 antibodies. Bands corresponding to core histones in the silver-stained gel are starred. (B) Infectivity of Mo-MLV VLPs carrying alterations in p12. HeLa cells were challenged with equivalent RT units of LacZ-encoding VLPs carrying Mo-MLV p12_WT, M63I, G49R/E50K or p12+hCBS +/- Mut14, and infectivity was measured 72 h post-infection by detection of beta-galactosidase activity in a chemiluminescent reporter assay. The data are plotted as percentage of WT VLP infectivity (mean ± SEM of >3 biological replicates). (C) An alignment of p12 sequences from selected gammaretroviruses. The CTD region is shaded pink. The S61 and M63 residues of Mo-MLV p12 are highlighted in red and equivalent residues at position 63 and 64 are boxed. CTD peptide sequences used in subsequent BLI assays (Fig 9) are in bold. (D and E) Representative silver stained gel (top) and immunoblot (bottom) showing interaction of a panel of GST-tagged p12 orthologues (D) and GST-tagged FeLV_p12 mutants I52M and A53V (E) to chromatin associated proteins. GST-pull down assays were performed as in (A). (E) The amount of histone H2B pulled-down with GST-p12 was quantified for each sample by estimating median band intensity of immunoblots using a Li-cor Odyssey imaging system and plotted in the bar chart as mean ± SD of 3 technical replicates.

