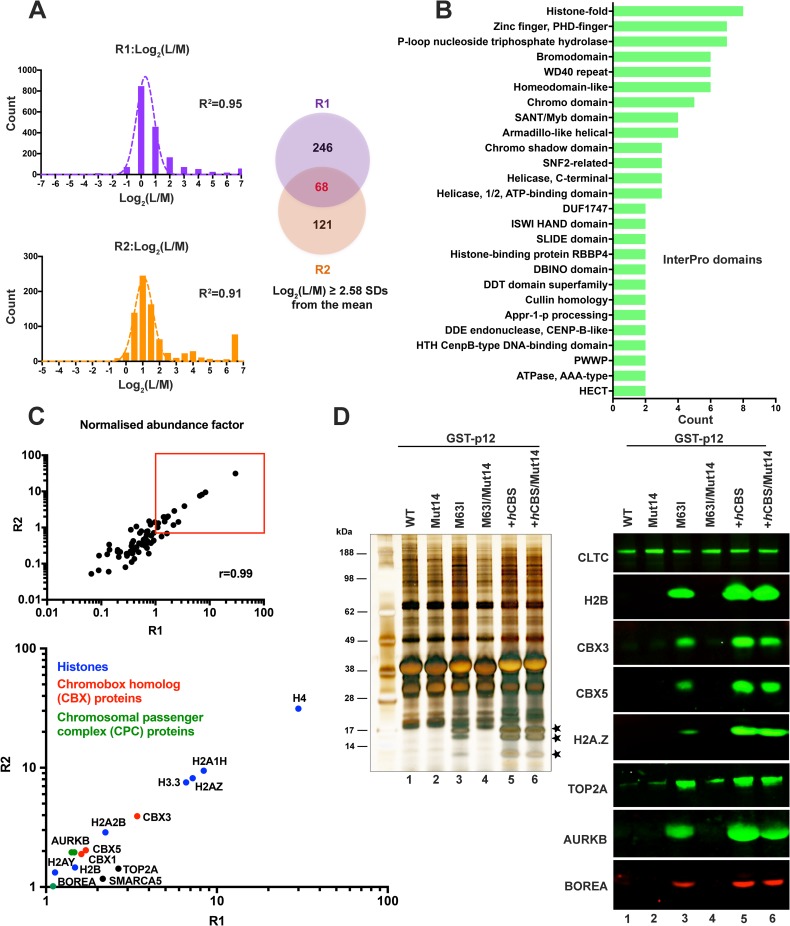
Fig 8. GST-p12_M63I interacts with the same chromatin-associated proteins as PFV CBS.
Cellular proteins interacting with GST-p12_M63I were identified using SILAC-MS. Two biological repeats (R1 and R2) were performed. GST-p12_M63I and GST-p12_WT were transiently expressed in 293T cells cultured in light (R0/K0) or medium (R6/K4) SILAC media respectively. Cells were treated with nocodazole for mitotic enrichment and then lysed for glutathione-sepharose bead pull-down assays followed by MS. (A) Identification of proteins enriched in the light-labelled GST-p12_M63I (L) sample relative to medium-labelled GST-p12_WT (M) sample. Log2(L/M) silac ratios of the set of MS hits (FDR <5%) from each replicate were plotted as a frequency distribution. Mean and standard deviation (SD) of each distribution was estimated by fitting to a normal distribution curve (R2≥0.91). MS hits with log2(L/M) ratios greater than 2.58 SDs from the mean were selected as significantly enriched in the GST-p12_M63I (L) sample. Of the 314 such proteins identified in R1, 68 were also found in R2 (Venn diagram). (B) Functional classification of the 68 GST-p12_M63I interacting proteins in (A) was performed based on InterPro domain annotation. (C) The abundance factor for each protein was calculated by dividing the peptide spectral count by its length. These values were then normalised across the group and the scores for R1 plotted against the scores for R2 (Pearson correlation r = 0.99). MS hits with normalised abundance factors ≥1 in both replicates are boxed in red (top panel) and expanded in the bottom panel. The points are coloured according to the protein function shown in the key: Blue, nucleosomal histone proteins; Red, chromobox homolog proteins; Green, chromosomal passenger complex proteins; Black, others. (D) Validation of SILAC results. 293T cells were transiently-transfected with expression constructs for GST-tagged Mo-MLV p12_WT (lane 1), p12_mut14 (lane 2), p12_M63I (lane 3), p12_M63I/mut14 (lane 4), p12+hCBS (lane 5) and p12+hCBS/mut14 (lane 6) and GST pull-down assays were performed and analysed as in Fig 6. Immunoblots (right hand panels) were probed with a selection of antibodies to host proteins of interest (S4 Table). Bands corresponding to core histones in the silver-stained gel are starred.

