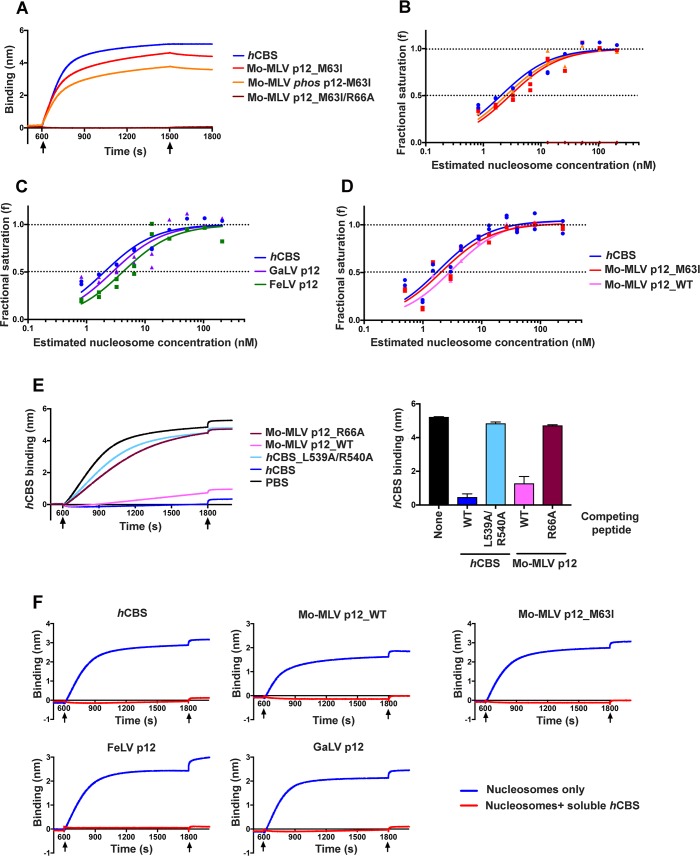
Fig 9. The p12 CTD directly binds recombinant nucleosomal arrays.
Direct interactions between p12 CTD peptides and nucleosomal histone proteins was tested using biolayer interferometry (BIL). Streptavidin sensor probes were coated with biotinylated p12 CTD or hCBS (positive control) peptides to equivalent levels and then immersed in analyte solutions containing recombinant poly-nucleosomes to measure binding. (A) Representative sensorgrams showing binding of peptides corresponding to the CTD of Mo-MLV p12_M63I, phos p12-M63I (S61-phosphorylated), p12_M63I/R66A or hCBS to recombinant poly-nucleosomes (~250 nM). Black arrows indicate the beginning and end of the association phase. (B-D) Affinity measurements were derived by probing peptides corresponding to hCBS (B-D) or the CTD of Mo-MLV p12_M63I, phos p12-M63I (B), GaLV p12, FeLV p12 (C) or Mo-MLV p12_WT (D) against a range of serially-diluted nucleosomes. Equilibrium binding data from two technical replicates were pooled for the analysis. The plotted data are fractional saturation of binding as a function of nucleosome concentration. (E) Competition assay inhibiting nucleosome binding to immobilised biotin-tagged hCBS with soluble non-biotinylated hCBS or Mo-MLV p12 CTD peptides as indicated in key (100 μM). Left panel shows representative sensorgrams with black arrows indicating the beginning and end of the association phase. The bar chart shows equilibrium binding of hCBS in the presence and absence of competing peptides as mean ± SD from three technical replicates. (F) Representative sensorgrams showing competition assay inhibiting nucleosome binding to immobilised biotin-tagged p12 CTD peptides or hCBS, as indicated in graph title, with soluble non-biotinylated hCBS (100 μM, red lines). Black arrows indicate the beginning and end of the association phase. See methods for peptide sequences.

