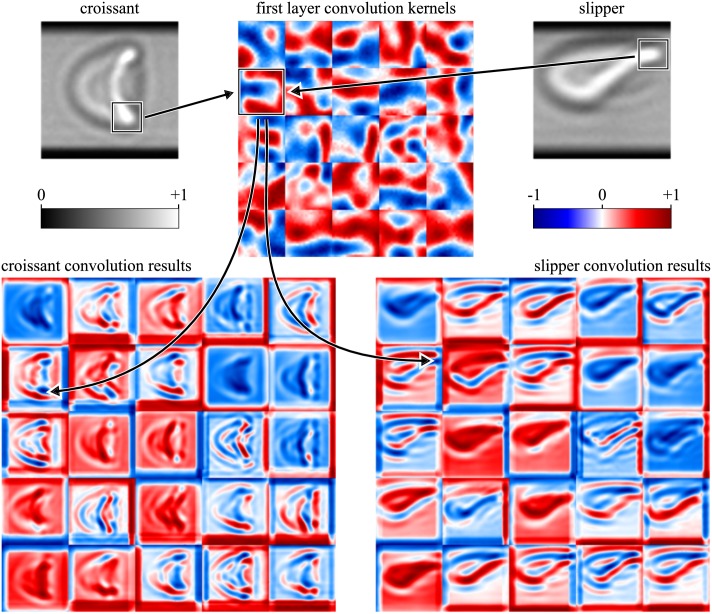
Fig 2. Resulting subimages (bottom) of two contrary RBC shapes (croissant, upper left; slipper, upper right) passing the first convolutional layer of a CNN.
The convolution kernels as well as the subimages are represented by a false color mapping for the sake of better visibility. Boxes in the input images indicate typical features of both cell shape classes and the respective enhancement of these after convolution (indicated by arrows).

