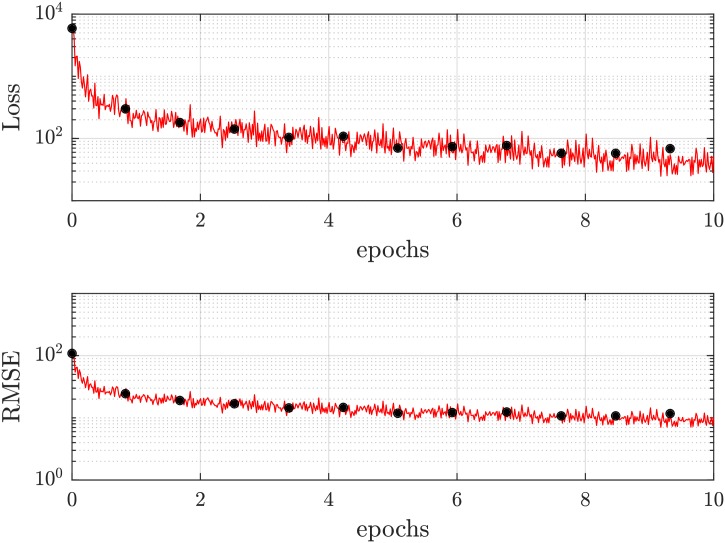
Fig 3. Diagram of training (red) and validation (black) status: Evolving convergence loss with growing number of training epochs.
We set a maximum of ten epochs since a prolongation to more training epochs yields no gain in performance but rather causes overtraining. As training method, a gradient descent solver with momentum (SGDM) is used. The red line indicates the training loss, whereas the black dots represent the loss of the validation data set (validation loss). The progression of the validation loss serves as an indicator whether the CNN is overtrained, since the training and validation losses would diverge. As loss function, a root-mean-square error is chosen, being a standard approach for regression problems.

