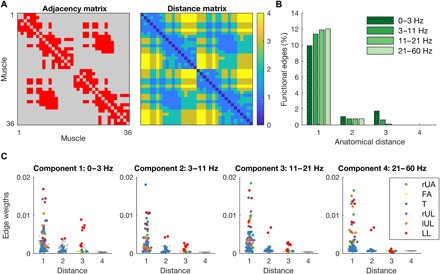
Fig. 3. Relationship between functional connectivity and anatomical distance.

(A) Adjacency and distance matrix of the anatomical muscle network. The maximum anatomical distance (path length) is 4. (B) Percentage of functional edges of thresholded networks across experimental conditions as a function of anatomical distance. (C) Distribution of edge weights of functional networks as a function of anatomical distance for each layer. Weights were averaged across experimental conditions. Edges connecting muscles within the same module are color-coded (rUA, right upper arm; FA, bilateral forearms; T, torso; rUL, right upper leg; lUL, left upper leg; and LL, bilateral lower legs), and gray dots represent edges between modules.
