
Fig. 2. Mapping mechanical force exerted by human podocytes throughout differentiation.
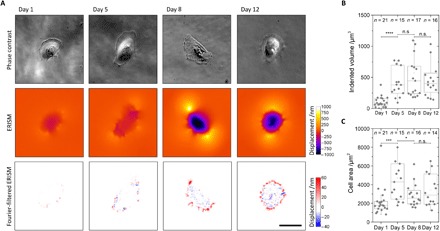
(A) Representative phase-contrast images (upper row), ERISM displacement maps (middle row), and Fourier-filtered ERISM maps (lower row) taken at different time points during the 12-day differentiation of LY podocytes. (B and C) Tukey boxplots of (B) mechanical activity and (C) cell area during LY podocyte differentiation. Each dot represents one cell. As data in groups were not normally distributed, groups were compared using the Mann-Whitney U test (n.s., no significance; *P < 0.05; ***P < 0.001; ****P < 0.0001). Scale bars, 50 μm.