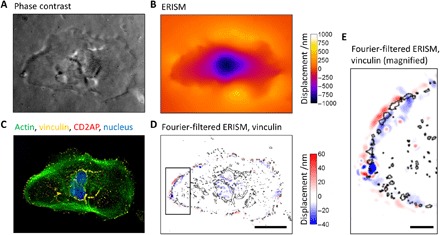
Fig. 3. Contractile podocyte forces are colocalized with vinculin expression.

(A) Phase-contrast image and (B) ERISM displacement map generated by a fully differentiated podocyte (day 12). (C) Epifluorescence image of the same cell following fixation and immunostaining for actin, vinculin, CD2AP, and nuclear DNA. (D) Fourier-filtered ERISM map, with black lines indicating vinculin-rich areas. Scale bar, 50 μm. (E) Magnification of the area highlighted in (D). Scale bar, 10 μm.
