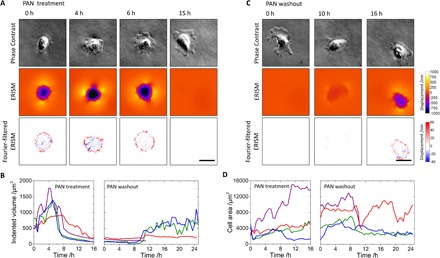
Fig. 5. Mapping podocyte force transmission in a PAN injury model.

(A and C) Phase-contrast images (upper rows), ERISM displacement maps (lower rows), and Fourier-filtered ERISM maps (lower rows) during (A) PAN treatment and (C) PAN washout of an LY podocyte. Before the measurement, the cell was allowed to differentiate on the ERISM microcavity substrate over the course of 12 days. (B and D) Change in exerted cell force (B) and cell area (D) during PAN treatment and PAN washout, continuously measured for four different cells. The green trace corresponds to the cell shown in (A) and (C). The purple trace corresponds to a cell that dies at 11.5 hours, presumably as a result of the PAN injury. Scale bars, 50 µm.
