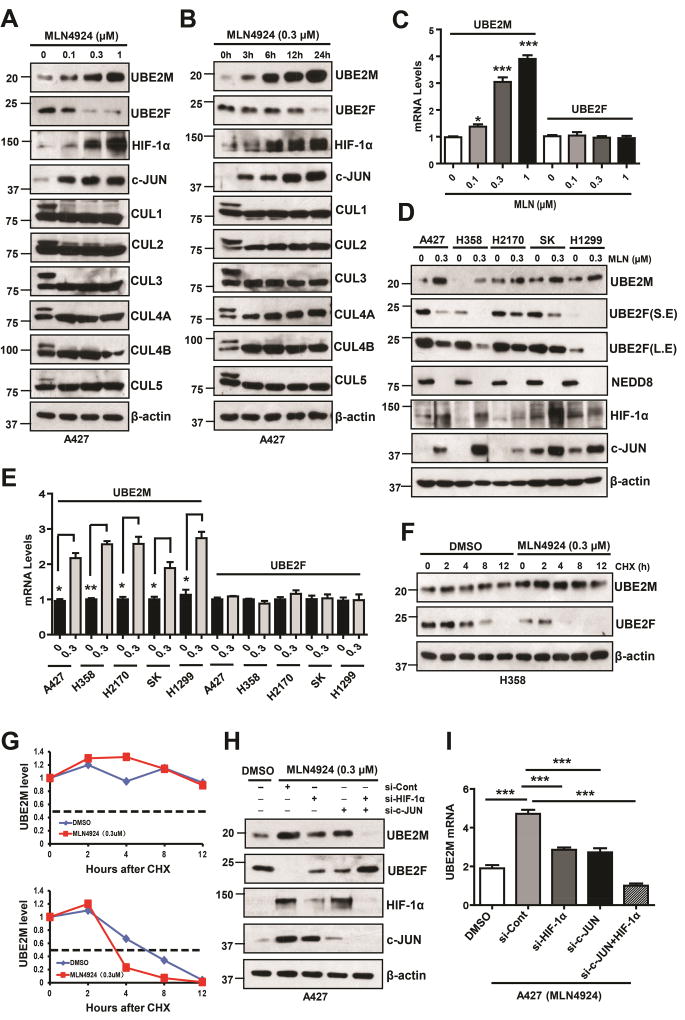
Figure 1. MLN4924 differentially regulates UBE2M and UBE2F.
(A and B) A427 cells were treated with MLN4924 at indicated concentrations (24 h) or time points, followed by IB using indicated Abs.
(C) A427 cells were treated with different doses of MLN4924 for 24 h, followed by qRT- PCR. Data are represented as mean ± SEM of three independent experiments. * p < 0.05; *** p < 0.001, based on One-way ANOVA.
(D and E) Various lung cancer cell lines were treated with DMSO or MLN4924 (0.3 µM) for 24 h, followed by IB with indicated Abs (D) or qRT- PCR assay. Data are represented as mean ± SEM of three independent experiments. * p < 0.05; ** p < 0.01, based on the Student’s t test (E).
(F) H358 cells were treated with MLN (0.3 µM) for 24 h and then switched to fresh medium (10% FBS without MLN4924) containing cycloheximide (CHX) and incubated for indicated time periods before being harvested for IB.
(G) Measurement of UBE2M and UBE2F T1/2: the band density was quantified using ImageJ software and plotted.
(H and I) A427 cells were transfected with indicated siRNAs and treated with MLN4924 0.3 µM for 24 h, followed by IB (H) or qRT-PCR assay (I). Data are represented as mean ± SEM of three independent experiments. *** p < 0.001, based on One-way ANOVA.
See also Figure S1.

