
Fig. 5. General putrescine production pathway from arginine via agmatine in the human intestinal microbiome.
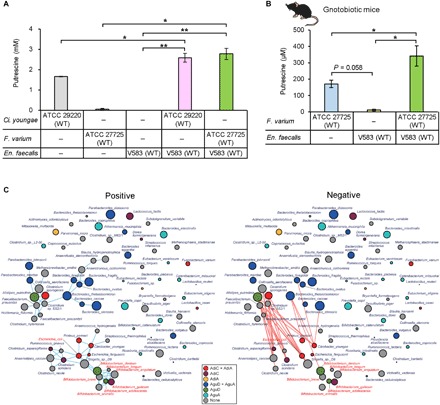
(A) Extracellular putrescine concentration in monoculture of Ci. youngae ATCC 29220 or F. varium ATCC 27725 and in coculture of Ci. youngae ATCC 29220 or F. varium ATCC 27725 with wild-type En. faecalis (V583). (B) Fecal putrescine concentration in gnotobiotic mice inoculated with F. varium ATCC 27725 and wild-type En. faecalis (V583). Mono- and cocultures of these bacteria were conducted under anaerobic conditions at 37°C for 24 hours in LB-RGC medium. (C) Symbiont-symbiont co-occurrence networks of key genes in the putrescine production pathway using previously described human microbiome data from U.S. metropolitan areas (26). Blue and red lines between bacterial species indicate statistically significant aggregation and segregation, respectively. Names of Bifidobacterium spp. and E. coli are shown in red. The size of the circles represents the number of reads identified. Circle colors: red, bacterial species that have AdiC and AdiA; deep pink, bacterial species that have AdiC; gold, bacterial species that have AdiA; blue, bacterial species that have AguD and AguA; chartreuse, bacterial species that have AguD; cyan, bacterial species that have AguA; gray, other bacterial species. Error bars represent SE. *P < 0.05 and **P < 0.01, one-way ANOVA with Tukey’s test and Student’s t tests.