
Fig. 2. Nonhuman primate blood chemistry and liver function data before and after 7C1 siRNA treatment.
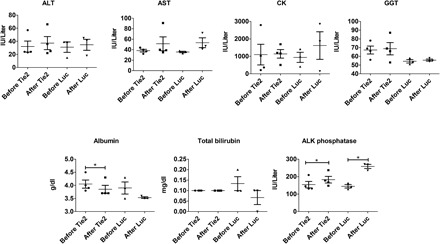
Levels were examined for both Tie2 and Luc control siRNA treatments. A t test was used to determine any temporal changes in concentrations, and horizontal lines with an * above indicate P < 0.05. Regardless of statistically significant differences, all measured concentrations fell within their respective normal reference ranges.