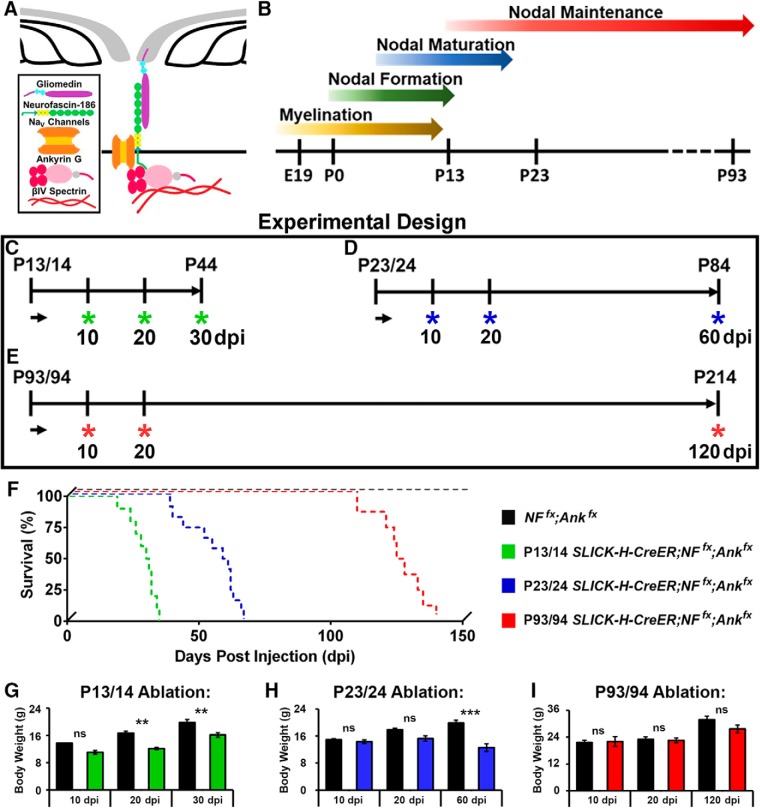
Figure 1.
Timing of NF186/AnkG ablation alters survival. A, Schematic diagram of key proteins involved in the organization and/or stabilization of nodes of Ranvier within myelinated fibers in the PNS. B, Timeline of myelination, nodal formation, maturation, and nodal maintenance in mice. C–E, Schematic representation of tamoxifen injections schemes for Ank3 and NfascNF186 ablation from myelinated axons. SLICK-H-CreER;NFfx;Ankfx and NFfx;Ankfx control mice were injected at P13/14 (C), P23/24 (D), or P93/94 (E) and analyzed 10, 20, 30, 60, or 120 dpi. (F) Survival curve representing the numbers of days lived after tamoxifen ablation for SLICK-H-CreER;NFfx;Ankfx mice injected at P13/14 (green line), P23/24 (blue line), or P93/94 (red line) compared to age-matched NFfx;Ankfx littermates (black line). Each curve is significantly different (p < 0.0001) from each other by Mantel–Cox log rank test, Bonferroni post hoc analysis (n = 8–10 mice/group). G–I, Graph representing the body weight of NFfx;Ankfx (black bar) and SLICK-H-CreER;NFfx;Ankfx mice injected at P13/14 (G, green bar), P23/24 (H, blue bar), or P93/94 (I, red bar). Black asterisks indicate statistical differences between control and mutant at each time point by two-way ANOVA, Tukey post hoc analysis (n = 8–10 mice/group). Data are represented as mean ± SEM.

