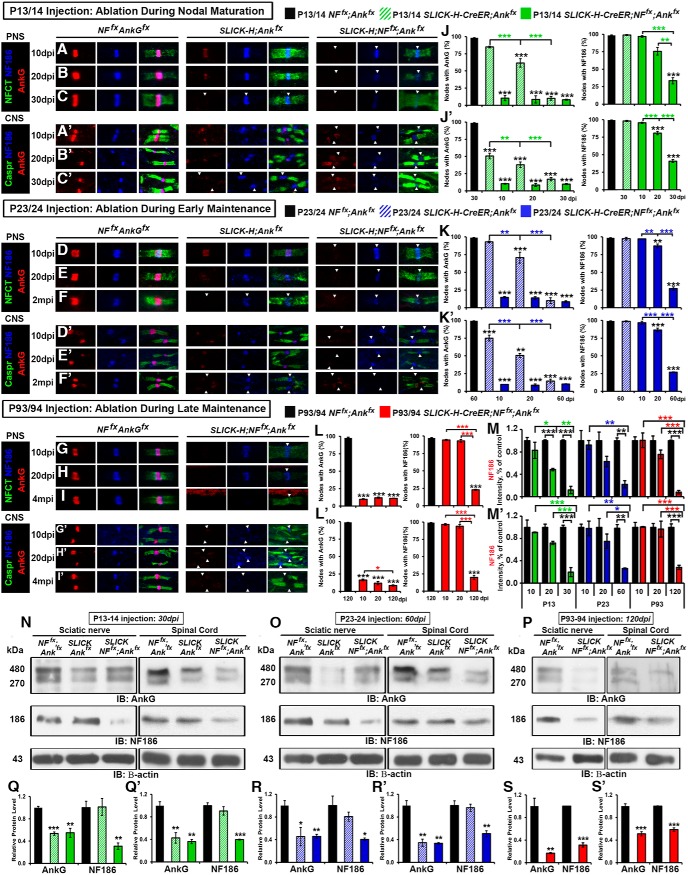
Figure 2.
Combined ablation of NF186/AnkG reduces the nodal stability of AnkG and NF186. A–C′, After tamoxifen ablation during nodal maturation (P13/14), SN fibers and SCs from NFfx;Ankfx, SLICK-H-CreER;Ankfx, and SLICK-H-CreER;NFfx;Ankfx were harvested at 10, 20, and 30 dpi. D–F′, After tamoxifen ablation during early nodal maintenance (P23/24), SN fibers and SCs from NFfx;Ankfx, SLICK-H-CreER;Ankfx, and SLICK-H-CreER;NFfx;Ankfx were harvested at 10, 20, and 60 dpi. G–I′, After tamoxifen ablation during late nodal maintenance (P23/24), SN fibers and SCs from NFfx;Ankfx and SLICK-H-CreER;NFfx;Ankfx were harvested at 10, 20, and 120 dpi. All SNs (A–I) were teased and immunostained with antibodies against AnkG (red), NF186 (blue), and NFCT (green); while SCs (A′–I′) were immunostained with antibodies against AnkG (red), NF186 (blue), and Caspr (green). Arrowheads mark AnkG-negative nodes. J–L′, Quantification of the percentage of nodes with remaining AnkG and NF186 at various time points in NFfx;Ankfx (black bar), SLICK-H-CreER;Ankfx (striped green or blue bar), and SLICK-H-CreER;NFfx;Ankfx (solid green, blue, or red bar) SN (J–L) or SC (J′–L′). M, M′, Graphs representing intensity quantification of NF186 in the SN (M) and SC (M′) nodal area of SLICK-H-CreER;NFfx;Ankfx mice injected at P13/14 (green bars), P23/24 (blue bars), or P93/94 (red bars) normalized to age-matched NFfx;Ankfx control values (black bars). N–P, Immunoblot analysis of SN and SC lysates from NFfx;Ankfx littermates and SLICK-H-CreER;NFfx;Ankfx mice injected at P13/14 (30 dpi), P23/24 (60 dpi), or P93/94 (120 dpi) with antibodies against AnkG, NF186, and β-actin. Q–S′, Quantification of immunoblots relative to β-actin from the SN (Q–S) or SC (Q′–S′) lysates. All data are represented as mean ± SEM. Black asterisks indicate statistical differences between control and mutant; colored asterisks signify differences between time points among mutants. For immunostaining: n = 3–4 mice/group; 50–100 nodes per mouse; two-way ANOVA, Tukey post hoc analysis. For immunoblots: n = 3 mice; two-tailed Student’s t tests. Scale bar, 2 µm.

