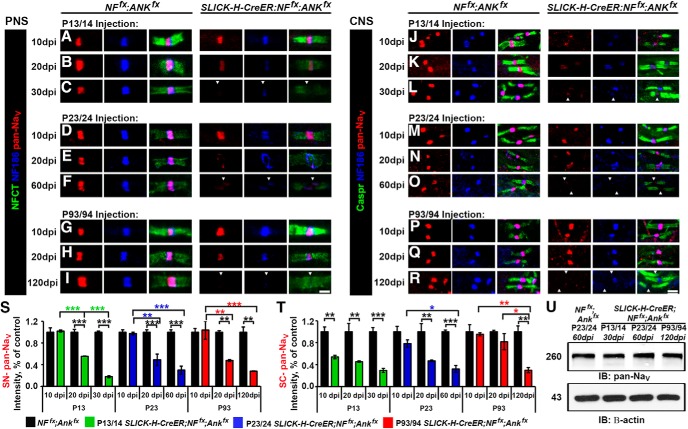
Figure 3.
Timing of NF186/AnkG ablation alters stability of sodium channels in the CNS. A–I, SN fibers from NFfx;Ankfx and SLICK-H-CreER;NFfx;Ankfx littermates injected at P13/14 (A–C, 10–30 dpi), P23/24 (D–F, 10–60 dpi), or P93/94 (G–I, 10–120 dpi) were triple immunostained with antibodies against pan-NaV (red), NF186 (blue), and NFCT (green). J–R, SCs from NFfx;Ankfx and SLICK-H-CreER;NFfx;Ankfx littermates injected at P13/14 (J–L, 10–30 dpi), P23/24 (M–O, 10–60 dpi), or P93/94 (P–R, 10–120 dpi) were triple immunostained with antibodies against pan-NaV (red), NF186 (blue), and Caspr (green). S, T, Graphs representing intensity quantification of pan-NaV in the SN (S) and SC (T) nodal area of SLICK-H-CreER;NFfx;Ankfx mice injected at P13/14 (green bars), P23/24 (blue bars), or P93/94 (red bars) normalized to age-matched NFfx;Ankfx control values (black bars). U, Immunoblot analysis of SC lysates from 60 dpi NFfx;Ankfx injected at P23/24 compared to SLICK-H-CreER;NFfx;Ankfx mice injected at P13/14 (30 dpi), P23/24 (60 dpi), or P93/94 (120 dpi) with antibodies against pan-NaV and β-actin. Arrowheads mark NF186-negative nodes. All data are represented as mean ± SEM (n = 3–4 mice/group; 50–100 nodes per mouse; two-way ANOVA, Tukey post hoc analysis). Black asterisks indicate statistical differences between control and mutant; colored asterisks signify differences between time points among mutants. Scale bar, 2 μm.

