
Figure 6.
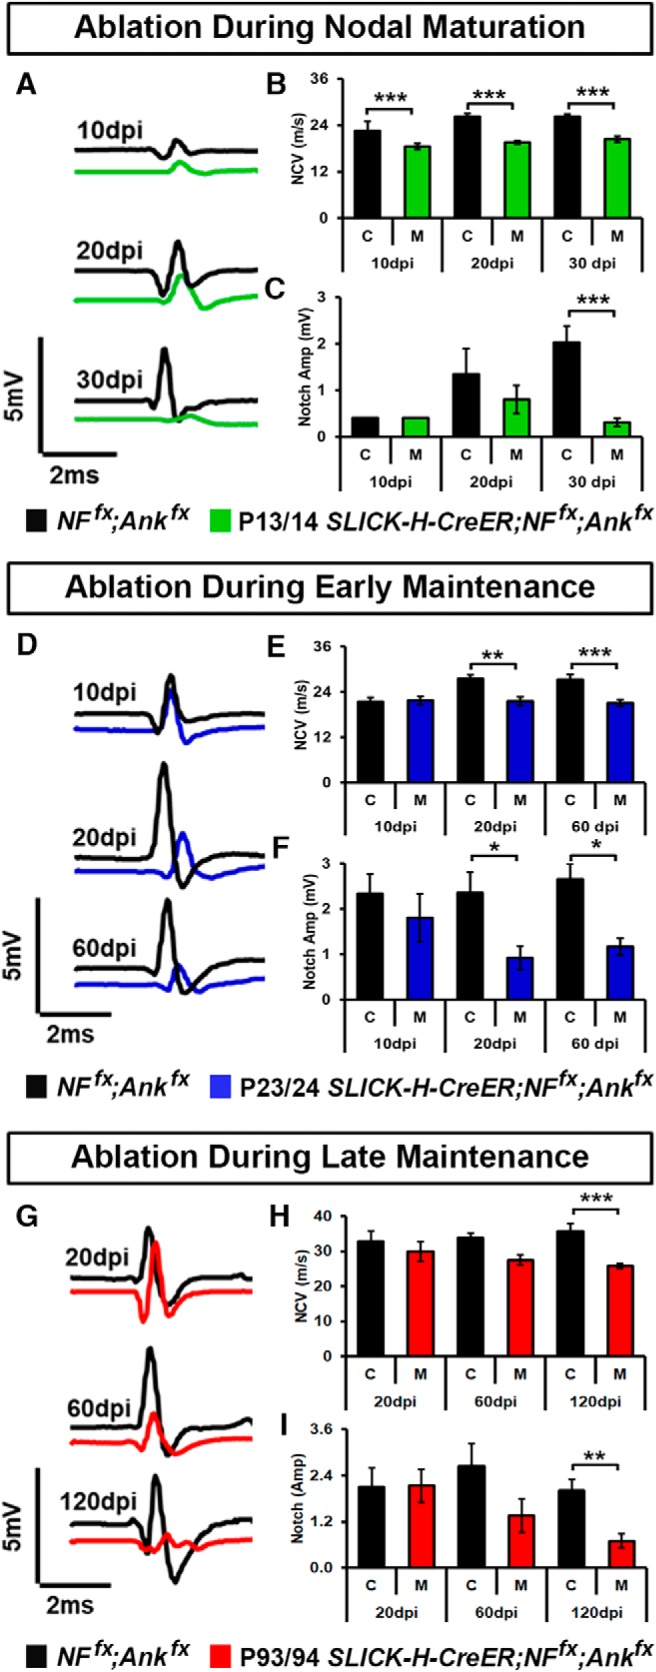
Combined loss of neurofascin 186 and AnkG severely impacts nerve conduction. A–C, Representative electrophysiological profiles (A) of compound action potentials (CAPs) from SNs 10, 20, and 30 days after tamoxifen injection during nodal maturation (P13/14) for NFfx;Ankfx (black line) and SLICK-H-CreER;NFfx;Ankfx (green line) with quantification of NCV (B) and amplitude (C). D–F, Representative electrophysiological profiles (D) of CAPs from SNs 10, 20, and 60 days after tamoxifen injection during early nodal maintenance (P23/24) for NFfx;Ankfx (black line) and SLICK-H-CreER;NFfx;Ankfx (blue line) with quantification of NCV (E) and amplitude (F). G–I, Representative electrophysiological profiles (G) of CAPs from SNs of 10, 60, and 120 days after tamoxifen injection during late nodal maintenance (P93/94) for NFfx;Ankfx (black line) and SLICK-H-CreER;NFfx;Ankfx (blue line) with quantification of NCV (H) and amplitude (I). All data are represented as mean ± SEM (n = 6–8 mice/group; two-way ANOVA, Tukey post hoc analysis). Black asterisks indicate statistical differences between control and mutant; colored asterisks signify differences between time points among the mutant group.