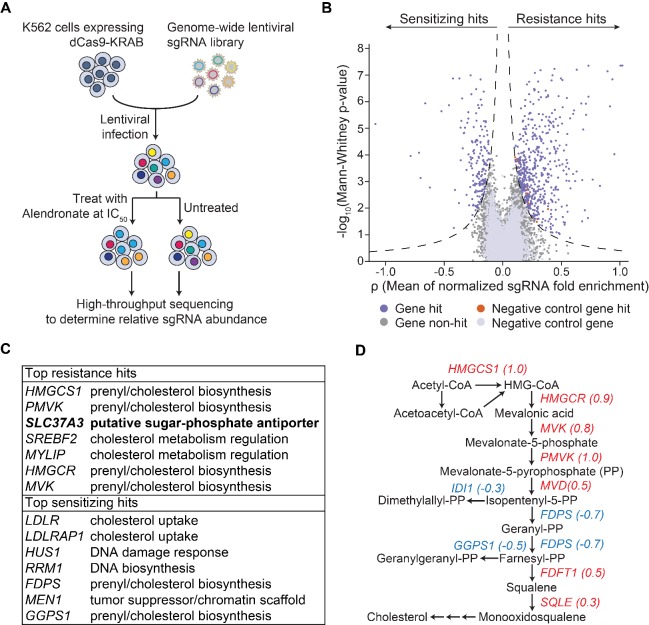
(
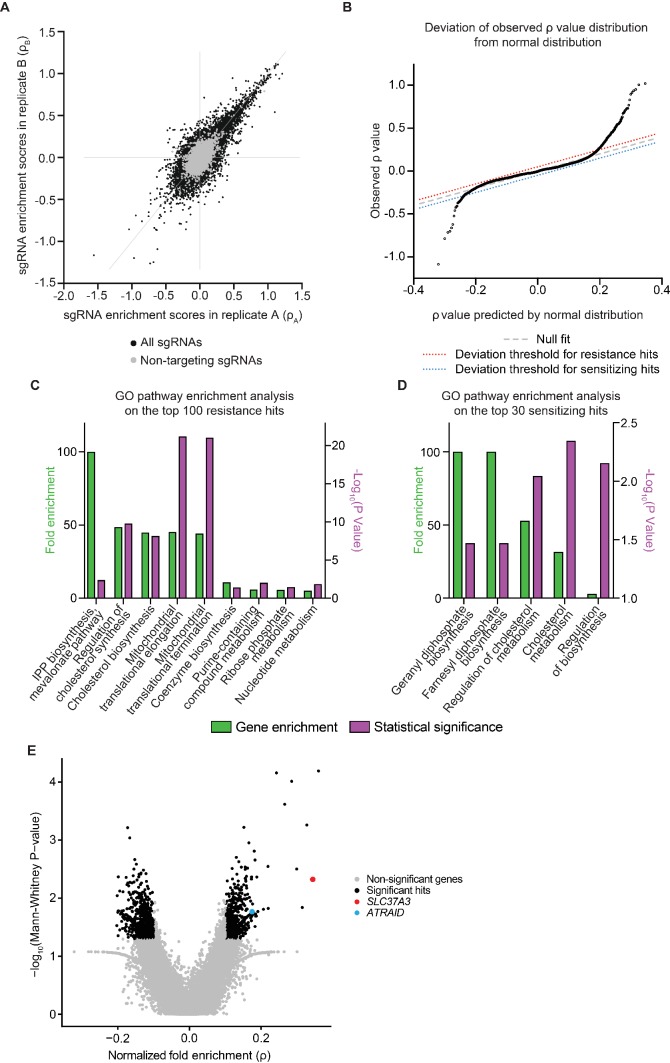
A) Evaluation of the reproducibility of the CRISPRi screen. The enrichment score (ρ) of each sgRNA was calculated separately from two biological replicates of the CRISPRi screen and compared in a scatter plot. Data points corresponding to negative control sgRNAs are colored in gray. (
B) Quantile-quantile plot comparing the distribution of observed average sgRNA enrichment scores (ρ scores) of each gene in the genome with a Gaussian distribution that has the same mean and standard deviation. The dashed gray line represents the predicted location of data points if the distribution of ρ scores is indeed Gaussian. The large deviations from the gray line observed at the two ends of the distribution indicate that the silencing of those genes has stronger effects than expected by pure Gaussian noise and is therefore likely to be biologically meaningful. The dotted lines are arbitrary thresholds set to select resistance hits (red dotted line) and sensitizing hits (blue dotted line) that deviate significantly from Gaussian predictions. 398 resistance hits and 28 sensitizing hits passed the thresholds. (
C–D) Gene Ontology (GO) pathway enrichment analysis of the top 100 resistance hits (
C) and the top 30 sensitizing hits (
D) identified in the CRISPRi screen. Only the most specific subclasses that are statistically significant are shown. Both fold enrichment of pathway genes and
P-values of fold enrichment are displayed. Fold enrichment values were clipped at 100 fold.
P-values were corrected for multiple testing using Bonferroni correction. Note that genes involved in the mevalonate pathway, which includes IPP biosynthesis, geranyl phosphate synthesis and farnesyl phosphate synthesis, are significantly enriched in top hits from the screen. IPP: isopentenyl pyrophosphate. (
E) Volcano plot showing the results from a second CRISPRi screen using zoledronate, another representative N-BP, as the selection agent. Plot layout is the same as in
Figure 1B.
SLC37A3 and
ATRAID are highlighted in red and cyan, respectively. Significant hits were defined as genes that had a fold enrichment with an absolute value larger than 0.1, and a P-value smaller than 0.05.


