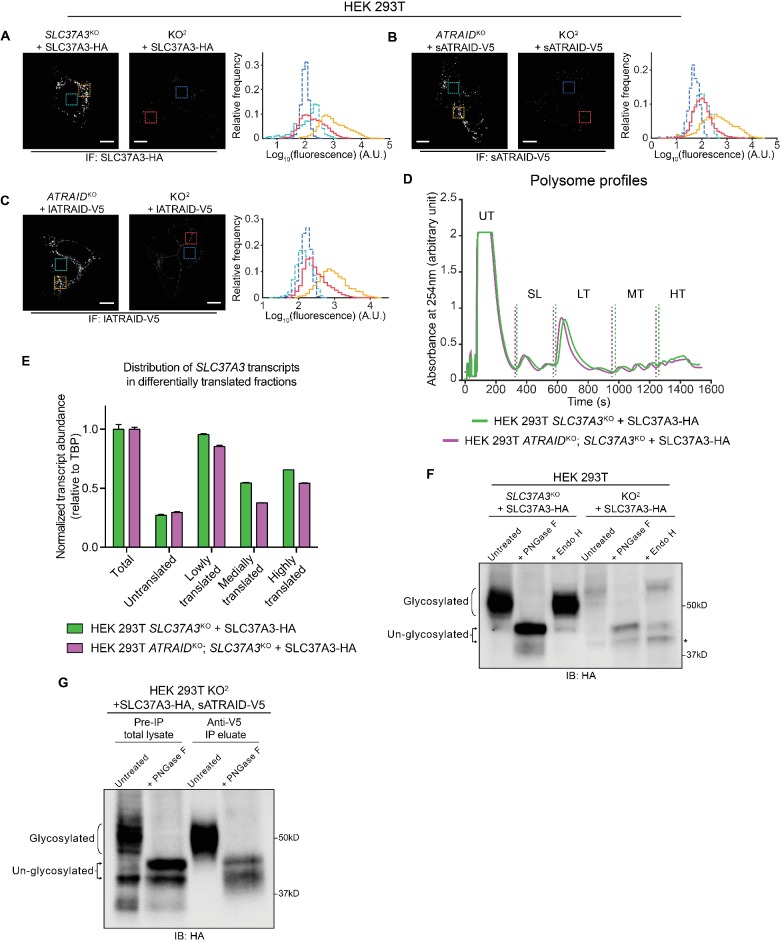
(A–C) Analysis of IF images comparing the expression levels of SLC37A3-HA (A) or both isoforms of ATRAID-V5 (B and C) in their respective single knockout backgrounds and the KO2 background. The two images in each sub-figure were acquired with the same setting and adjusted to the same contrast. In each image a background area (turquoise or blue, inside nuclei, where no stain should be present) and a signal area (orange or red) were selected and the distribution of pixel values within each area was plotted in a histogram. The outlines in the histogram are color-coded to match the boarders of selected areas. (D–E) Polysome profiling experiment assessing the translation efficiency of SLC37A3 transcripts in SLC37A3KO and KO2 backgrounds. Lysates from indicated cell lines were analyzed on a gradient station and fractionated into five fractions: untranslated transcripts (UT), small and large ribosome subunits (SL), lowly translated transcripts (LT), medially translated transcripts (MT) and highly translated transcripts (HT). The level of SLC37A3 transcripts relative to the level of TBP (TATA-binding protein) transcripts in each fraction was measured and plotted. The SL fraction was excluded from the analysis. A total RNA fraction was included as a reference. No overall shift was observed in the distribution of SLC37A3 transcripts in the KO2 background compared to that in the SLC37A3KO background, suggesting that the translation efficiency of SLC37A3 is not affected by the absence of ATRAID. (F) Immunoblot comparing the glycosylation patterns of SLC37A3 in SLC37A3KO and KO2 backgrounds. Lysates from SLC37A3KO + SLC37A3-HA (lane 1–3) and KO2 + SLC37A3-HA (lane 4–6) HEK 293 T cells were left untreated (lane 1 and 4), treated with PNGase-F (lane 2 and 5), or with Endo H (lane 3 and 6). The band corresponding to an un-glycosylated population of SLC37A3 that is present in the absence of ATRAID but not in the presence of ATRAID is marked with an asterisk. (G) Immunoblot comparing the glycosylation patterns of total cellular SLC37A3 and the sub-population of SLC37A3 that interacts with ATRAID. In KO2 HEK 293 T cells over-expressing SLC37A3-HA and sATRAID-V5, proteins that interact with sATRAID-V5 were purified with immuno-precipitation against V5 epitope and compared with total proteins in the lysate. The pre-IP total lysate (lane 1–2) and anti-V5 IP eluate (lane 3–4) were either left untreated (lane 1 and 3) or treated with PNGase F (lane 2 and 4) and analyzed by blotting against SLC37A3-HA. IF: immunofluorescence. IB: immunoblot. KO2: ATRAIDKO; SLC37A3KO. PNGase F: peptide: N-glycosidase F, an enzyme that removes all asparagine (N)-linked sugar modifications from glycoproteins. Endo H: endoglycosidase H, an enzyme that only removes high mannose sugar moieties on ER glycoproteins that have not been processed by the Golgi apparatus.


