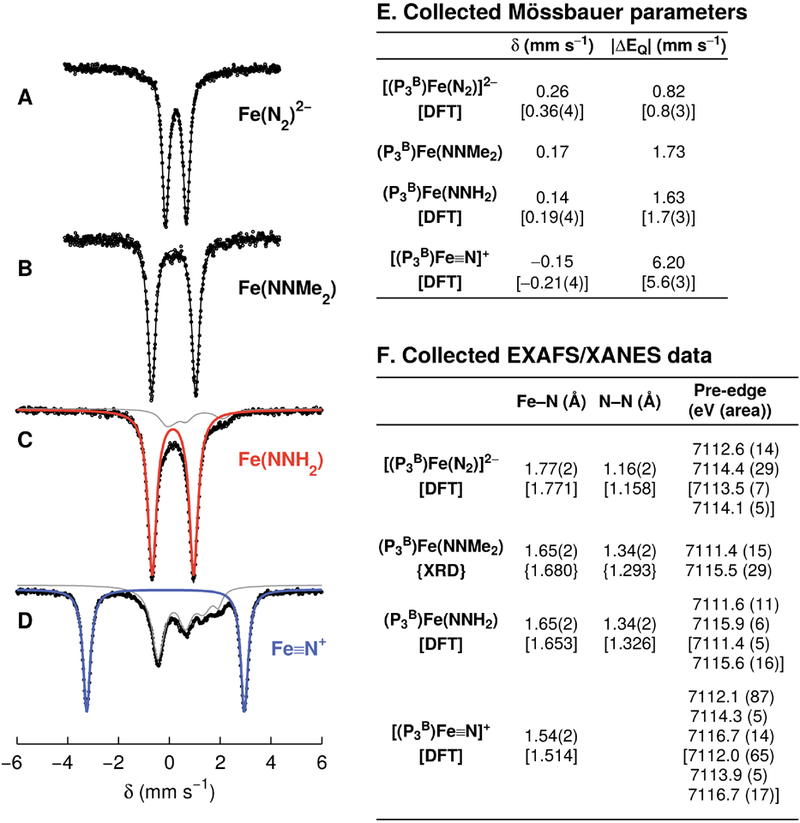
Figure 1.

(A–D) Collected Mössbauer data; raw data are shown as circles, and the simulated data as a solid black line with individual subspectra plotted in gray, red, and blue. (A) Spectrum of [(P3B)Fe(N2)]2− prepared in situ from [(P3B)Fe(N2)]−. (B) Spectrum of (P3B)Fe(NNMe2). (C, D) Freeze-quench Mössbauer spectra from the reaction of [(P3B)Fe(N2)]2− with excess TfOH, showing conversion to (P3B)Fe(NNH4) (red subspectrum, ~90%) after mixing for 15 min (C), and subsequent formation of [(P3B)Fe≡N]+ (blue subspectrum, ~60%) after mixing for 120 min (D). Collected Mössbauer and XAS characterization data for these species are given in tables E and F.
