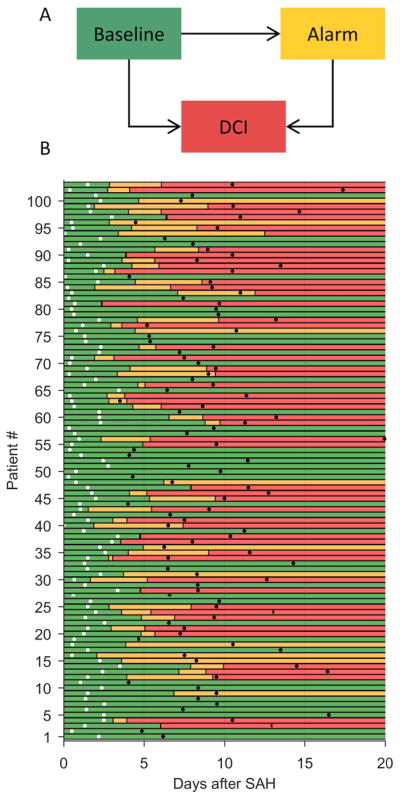
Figure 2. Time-to-event data.

(A) In the multistate survival analysis, patients occupy one of three possible states at any given time. Permissible transitions are indicated by arrows. (B) State occupancy versus time for 103 SAH patients, starting from the time of hemorrhage (t=0), continuing up to 20 days post-hemorrhage. Green bars indicate the baseline state (no EEG alarm or DCI thus far); yellow, the alarm state; and red, the DCI state. White dots indicate when EEG monitoring began, and black dots indicate when EEG monitoring ended.
