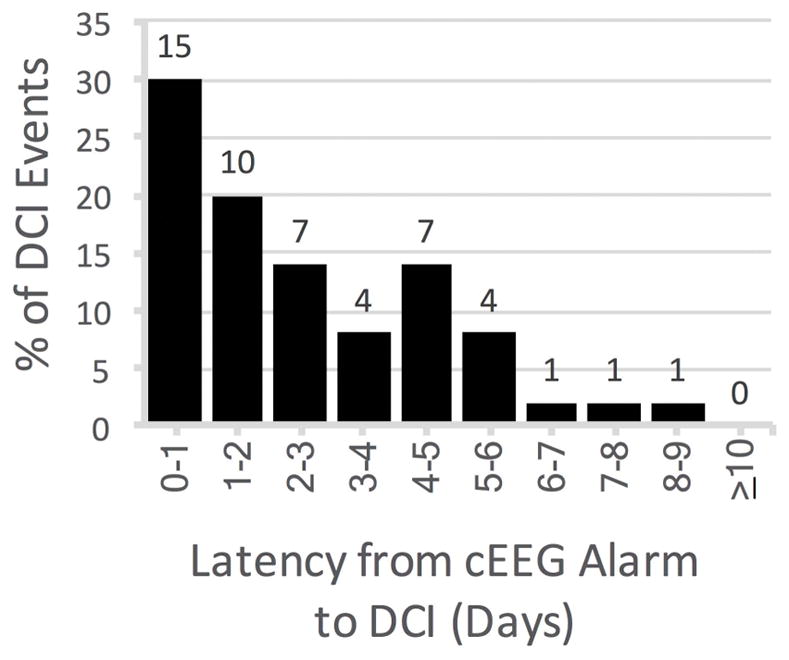
Figure 4. Latency from EEG alarm to diagnosis of DCI.

The histogram shows the proportion of the 50 true positive cases (y-axis) occurring within each time latency interval (x-axis) from EEG alarm to DCI. The 2 false negative DCI cases had no EEG alarm and are not shown. The median duration from EEG alarm to DCI was 1.9 days (minimum 30 min, maximum 9.1 days). 41 [82%] of 50 true positive cases had a lead time longer than 12-hours. cEEG = continuous EEG monitoring. DCI = delayed cerebral ischemia.
