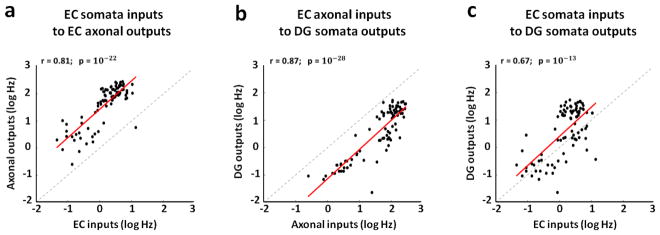
Figure 4.
The activity measured among axons correlates with the source and target evoked responses better than the separate EC somata with DG somata. We use a log scale to cover the large dynamic rage of the spike rates. (a) Strong positive correlation between EC inputs and axonal outputs in micro-tunnels (r=0.81, p=10−22, slope=1.05). (b) Stronger positive correlation between axonal inputs in the tunnels and DG somata outputs (r=0.87, p=10−28, slope=1.07). (c) High proportionality between EC inputs and DG outputs, consistent with feed-forward propagation of the information flow (r=0.67, p=10−13, slope=1.07). All points show the averaged log spike rate evoked at the tunnel and chamber electrodes in 80 ms (i.e., 40 ms x 2 pulses) over 25 trials from multiple arrays. Therefore, all scatter plots show 4 arrays x 22 stimulation sites = 88 points.

