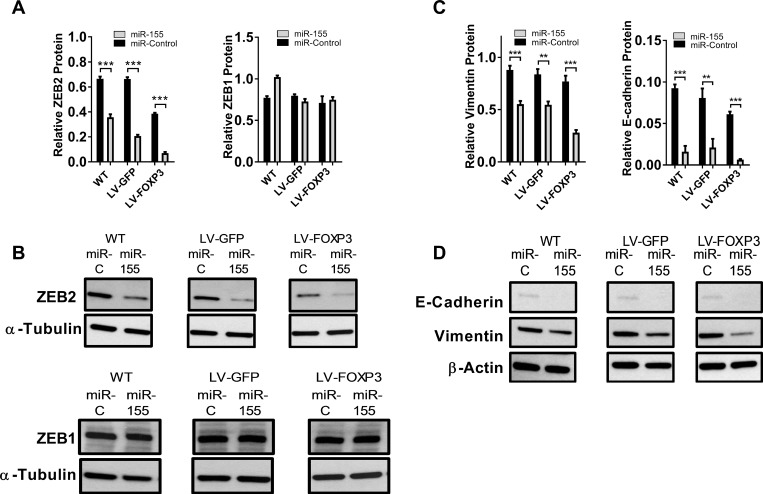
Figure 4. miR-155 and FOXP3 down regulate endogenous ZEB2 in human breast cancer cells resulting in altered levels of EMT markers Vimentin and E-cadherin.
(A) Relative abundance of ZEB2 and ZEB1 protein in WT, GFP or FOXP3 overexpressing BT549 cells transfected with miR-155 or miR-control. Relative abundance of protein was determined by quantitation of the abundance of ZEB2 or ZEB1 proteins normalised to reference protein α-Tubulin by western blot analysis. Quantitation of bands was carried out using Image J software. Mean + SD plotted. Student’s t test ***P < 0.001. ZEB1 protein expression as above. n = 3 experiments. (B) ZEB2 and ZEB1 protein in WT, GFP or FOXP3 overexpressing BT549 cells transfected with miR-155 or miR-control by western blot. Representative western blot shown. (C) Relative abundance of Vimentin and E-cadherin protein in WT, GFP or FOXP3 overexpressing BT549 cells transfected with miR-155 or miR-control. Relative abundance of protein was determined by quantitating the abundance of E-cadherin or Vimentin proteins and normalising to reference protein β-Actin by western blot analysis. Quantitation of bands was carried out using Image J software. Mean + SD plotted. Student’s t test ***P < 0.001, **P < 0.01. n = 3 experiments. (D) Vimentin and E-cadherin protein in WT, GFP or FOXP3 overexpressing BT549 cells transfected with miR-155 or miR-control analysed by western blot. Representative western blot shown.

