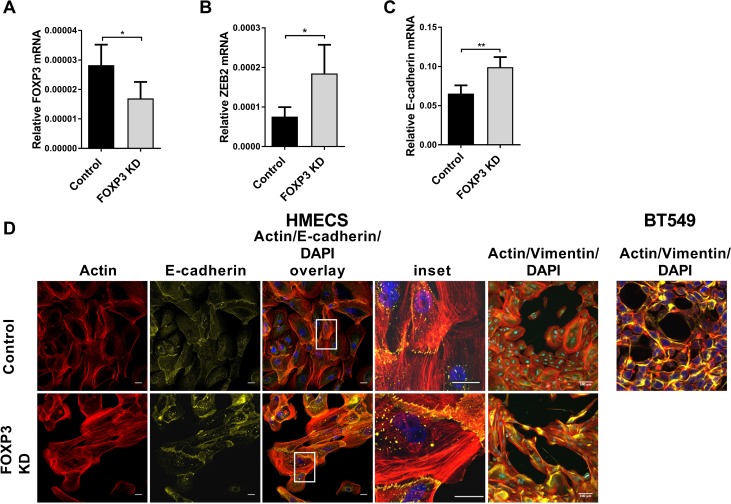
Figure 7. FOXP3 regulates ZEB2 expression in normal human mammary epithelial cells.
(A) Normal human mammary epithelial cells (HMEC) (passage 2) were transduced with either LV-FOXP3 KD or LV-Control lentivirus at MOI = 1 in the presence of 8ug/ml Polybrene. 72 hr after transduction total mRNA was isolated. Relative abundance of FOXP3 mRNA normalised to reference gene RPL13A mean + SEM is plotted, Student’s t test *P < 0.05. Quantitative real-time PCR reactions were in triplicate and the means of the threshold cycles (Cts) were used for quantitation. A standard curve to determine amplification efficiency was generated for FOXP3 and for the reference gene RPL13a mRNAs (see Methods section). The standard curve method for relative quantitation was used to determine the relative abundance of FOXP3 mRNA normalised to the RPL13a reference gene. n = 4 experiments. (B) Normal human mammary epithelial cells (HMEC) were transduced as above. Relative abundance of ZEB2 mRNA normalised to reference gene RPL13A is plotted + SEM, Student’s t test, *P < 0.05. Reactions for quantitative real -time PCR were run in triplicate, standard curves to determine amplification efficiency were determined for ZEB2 and RPL13a reference and the standard curve method for determination of relative abundance of mRNA was as in (A) above. n = 4 experiments. (C) Normal human mammary epithelial cells (HMEC) were transduced as above. Relative abundance of E-cadherin mRNA normalised to reference gene RPL13A is plotted + SEM, Student’s t test, **P < 0.01. Reactions for quantitative real -time PCR were run in triplicate, standard curves to determine amplification efficiency were determined for E-cadherin and RPL13a reference and the standard curve method for determination of relative abundance of mRNA was as in (A) above. n = 4 experiments. (D) HMEC cells were transduced with LV-FOXP3 KD or LV-control at an MOI = 1. 72 hr after virus transduction, cells were processed for immunofluorescence analysis: Alexa Fluor 647 conjugated – anti-E-cadherin (1:20) or AlexaFluor® 647conjugated anti-vimentin (1:50). Samples were counter stained with Alexa Fluor® 568 Phalloidin (F-Actin probe) and mounted in ProLong® Gold Antifade Fluorescent reagent, containing (DAPI) for nuclear staining. Confocal images were collected using identical exposure settings for each antibody fluorophore for FOXP3 KD and Control lentivirus transduced cells. Images are compositions of 12 optical sections of a Z-stack. Bar = 100 um. Inset shows enlargement of boxed area. BT549 cells similarly cultured and treated for comparison.

