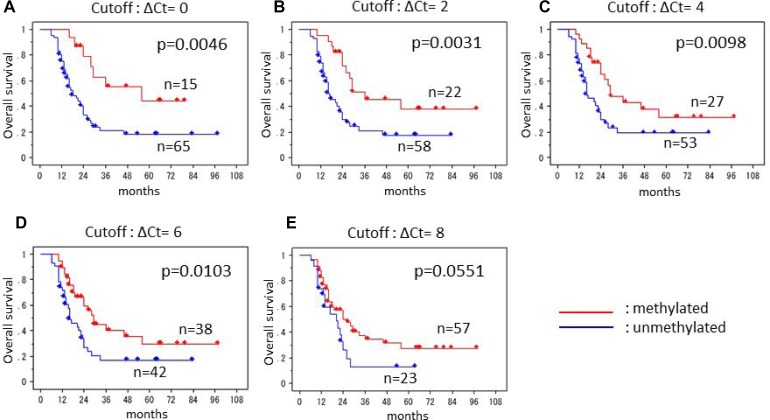
Figure 2. Kaplan-Meier survival curves of the patients with glioblastoma.
Five cutoffs of ΔCt values were applied to separate methylated and unmethylated groups; (A) cutoff ΔCt of 0, (B) cutoff ΔCt of 2, (C) cutoff ΔCt of 4, (D) cutoff ΔCt of 6, (E) cutoff ΔCt of 8. The smallest p-value was obtained at the cutoff off 2.

