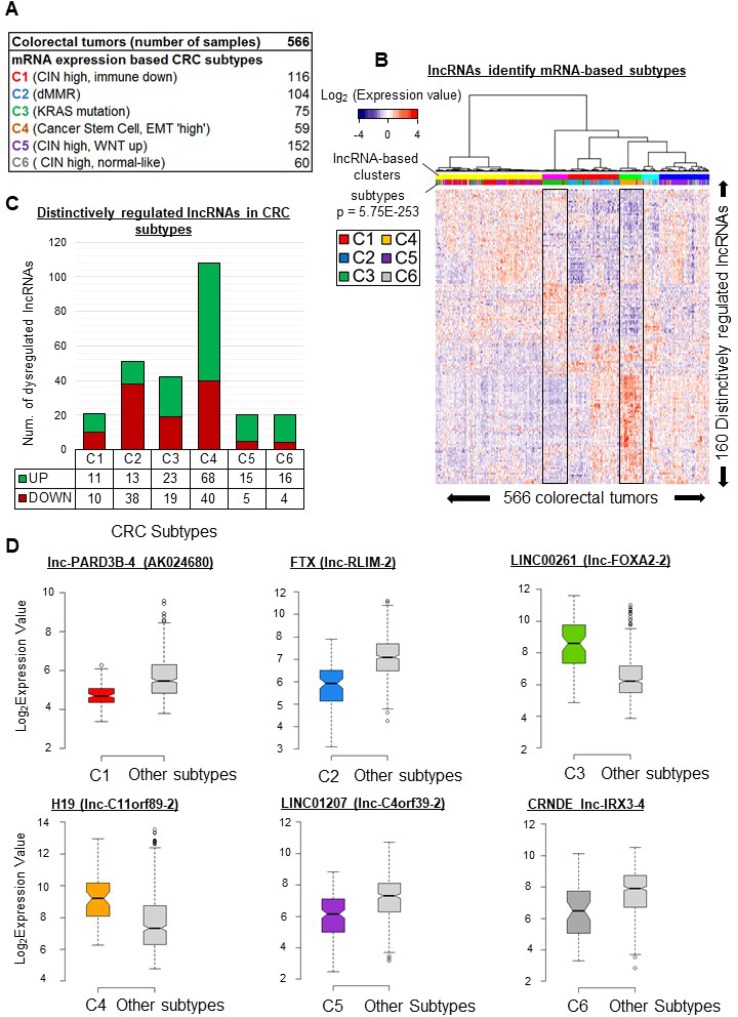
Figure 3. lncRNA gene expression patterns vary across CRC subtypes.
(A) Distribution of six mRNA-profile-based CRC subtypes [12] in the studied cohort. (B) Supervised clustering of tumors based on their lncRNA gene expression profiles. The profiles were based on levels of 160 unique lncRNAs identified as distinctively regulated in at least one subtype. (C) Number of distinctively regulated lncRNAs in each colorectal cancer subtype. The average expression level of an lncRNA in a given subtype is compared to its average level in all remaining subtypes. An lncRNA was considered to be distinctively regulated in a subtype when the fold change was above 1.5 or below 0.67 (FDR < 0.05) (D) Box plots illustrating the distinctive regulation of exemplative lncRNAs in given subtype. lnc-PARD3B-4 (also identified as AK024680), was downregulated (FC = 0.6, FDR = 8.7E-25) in C1-subtype tumors. lnc-RLIM-2 (also identified as FTX), was downregulated (FC = 0.44, FDR = 8.12E-21) in C2-subtype tumors. lnc-FOXA2-2 (also identified as LINC00261), appeared upregulated (FC = 5.18, FDR = 2.14E-14) in C3-subtype tumors as compared to all the other subtypes. H19 (identified here as lnc-C11orf89-2), was upregulated (FC = 3.6, FDR = 1.2E-06) in the C4 subtype. LINC01207 (identified here as lnc-C4orf39-2), appeared downregulated (FC = 0.45, FDR = 4.09E-11) in the C5 subtype. lnc-IRX3-4 (also identified as CRNDE), was downregulated (FC = 0.4, FDR = 0.0001) in the C6 subtype. P-values were assessed with t-test and corrected for multitesting with the Benjamini-Hochberg method. Box plot description: the bold line is the median, the borders of the box are the first and third quartiles and the whiskers (error bars) are the most extreme expression values not greater than 1.5 times the interquartile range. The notches represent the 95% confidence interval.

