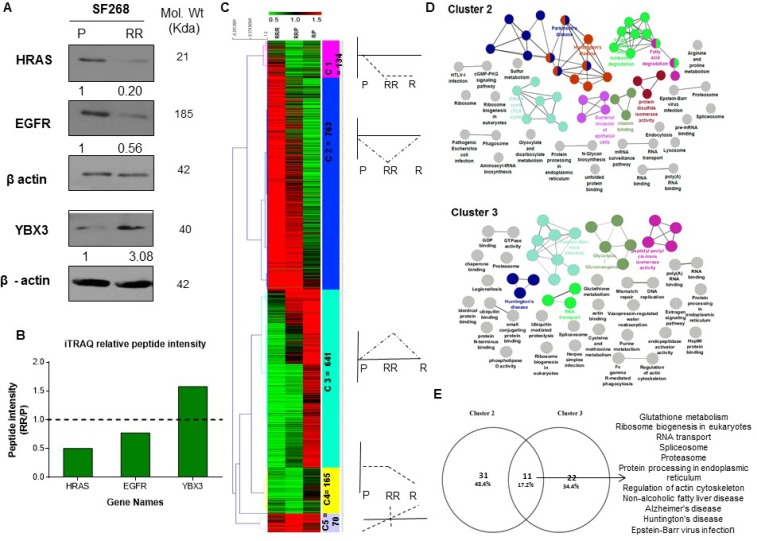
Figure 2. Proteomic analysis of the parent, radiation resistant and relapse population.
(A) Western blots showing the expression of HRas, EGFR, YBX3 in Parent (P), Radiation Resistant (RR) and Relapse (R) population of SF268 cell line. β-actin was used as loading control. (B) Bar plot of the relative peptide intensity values of the mentioned proteins in RR/P and R/P as determined by iTRAQ. (C) Heat map representation of unsupervised hierarchical clustering of the proteins based on their relative peptide intensities in R w.r.t RR, RR w.r.t P and R w.r.t P. Red- Up-regulation >1.5, Green- Down-regulation <0.5. Heat map is divided into clusters with a dotted plot representing the expression pattern of proteins in each cluster. (D) Pathway analysis of the Genes in cluster 2 and cluster were collapsed into pathways using ClueGo and CluePedia plugin of Cytoscape with KEGG and REACTOME pathway databases. Each coloured circle represents a pathway enriched with upregulated and downregulated protein in the RR cells but non-differential in the R cells. (E) Venn diagram for the overlap of pathways between cluster 2 and cluster 3

