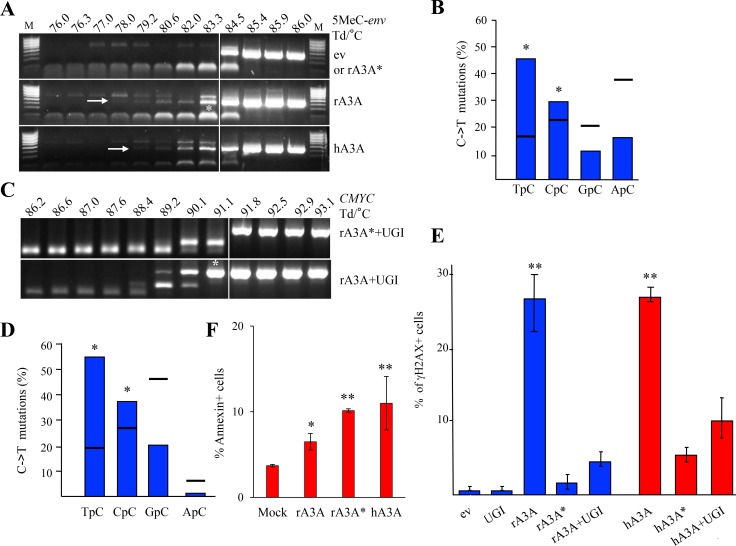
Figure 5. Rabbit A3A edits methylated DNA and generates DBSs driving cells to apoptosis.
(A) QT6 cells were co-transfected with 5-methylated HIV env DNA and A3 constructs and analyzed at 48 hours by 3D-PCR. Numbers above gels indicate the Td for each well. Vertical white bar indicates restrictive Td. White asterisk denotes 3D-PCR products cloned and sequenced. (B) Analysis of the 5′ nucleotide context of C->T transitions identified in cloned methylated HIV env DNA 3D-PCR products. Horizontal bars denote expected values derived from base composition. Asterisks denote a statistically significant difference (p < 0.05). (C) Quail CMYC DNA 3D-PCR gels derived from co-transfected QT6 cells at 48 hours first with UGI and then with rA3A or rA3A* expressing plasmid. Numbers indicate the Td for each well. White asterisk denotes PCR products cloned and sequenced. (D) Analysis of the 5′ nucleotide context of C->T transitions identified in A3 edited quail CMYC sequences. Percentages correspond to results obtained after rA3A + UGI co-transfection. Horizontal bars represent expected values derived from base composition. Asterisks show a statistically significant difference (p < 0.05). (E) FACS analysis of HeLa cells 48 hours post transfection with empty vector (ev), UGI or A3A constructs alone or in combination. Percentage of γH2AX positive cells are gated on V5 positive cells except for mock and UGI transfections. Double asterisks mean a highly statistically significant difference (p ≤ 0.005). (F) FACS analysis of HeLa cells 72 hours post transfection. Annexin positive cells were gated on V5-Tag positive cells, except for the mock condition. Single asterisks represent a statistically significant difference (p ≤ 0.05) and double asterisks represent a highly statistically significant difference (p ≤ 0.005).

