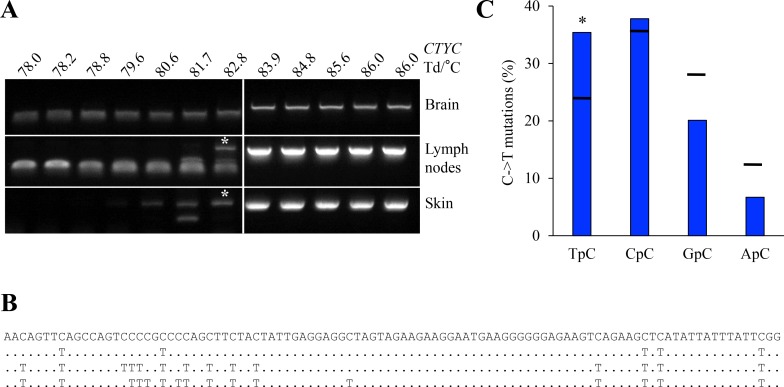
Figure 7. A3 edited mtDNA in vivo.
(A) Rabbit cytochrome c mtDNA 3D-PCR gels using total DNA from brain, lymph node and skin tissues. Numbers indicates the Td for each well. White bar indicates restrictive Td. White asterisks indicate cloned PCR products for sequences analysis. If rA3A is orthologous to hA3A then the edited mtDNA is derived from mtDNA leaked to the cytoplasm. (B) Representative mutated mtDNA sequences harboring C->T substitutions. Mutations are noted compared to reference sequence. (C) Analysis of the 5′ nucleotide context of C->T transitions identified edited cytoplasmic mtDNA. Horizontal bars represent expected values. Asterisks show a statistically significant difference (p < 0.05).

