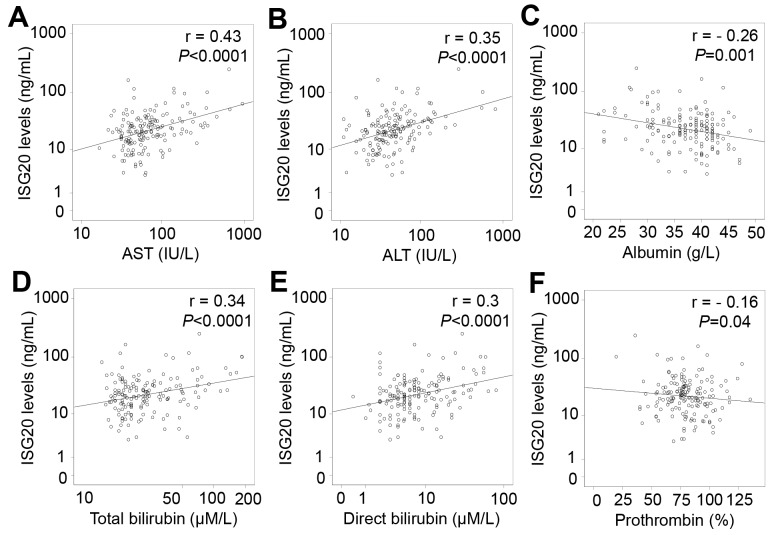
Figure 8. Correlation of ISG20 levels with clinical parameters in all HCC patients.
Correlations of ISG20 levels with different available clinical parameters were calculated by using Pearson correlation coefficient test. The Pearson’s r and P values are also presented. (A): Correlation between ISG20 levels and aspartate amino transferase (AST); (B): Between ISG20 levels and alanine amino transferase (ALT); (C): Between ISG20 levels and albumin; (D): Between ISG20 levels and total bilirubin; (E): Between ISG20 levels and direct bilirubin; and (F): Between ISG20 levels and prothrombin.

