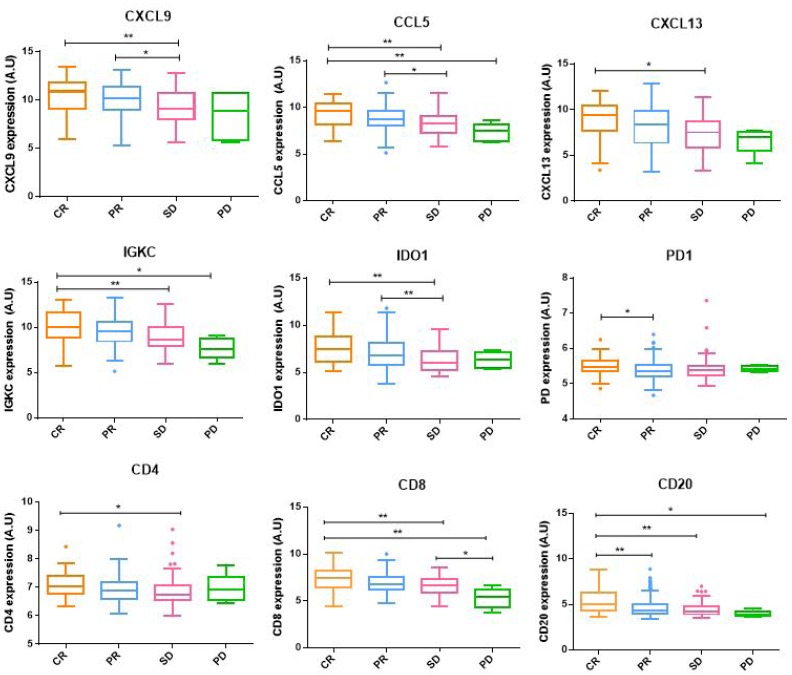
Figure 4. Immunological markers expression.
Immune-activating, immunosuppressive and cell lineage markers gene expression between pathological response groups. Box-and-whisker plots are Tukey boxplots. All p-values were two-sided and p < 0.05 was considered statistically significant. P-value < 0.05 (*); p-value < 0.01(**); p-value < 0.001 (***); p-value <0.0001 (****). A.U: arbitrary units.

