
Fig. 3.
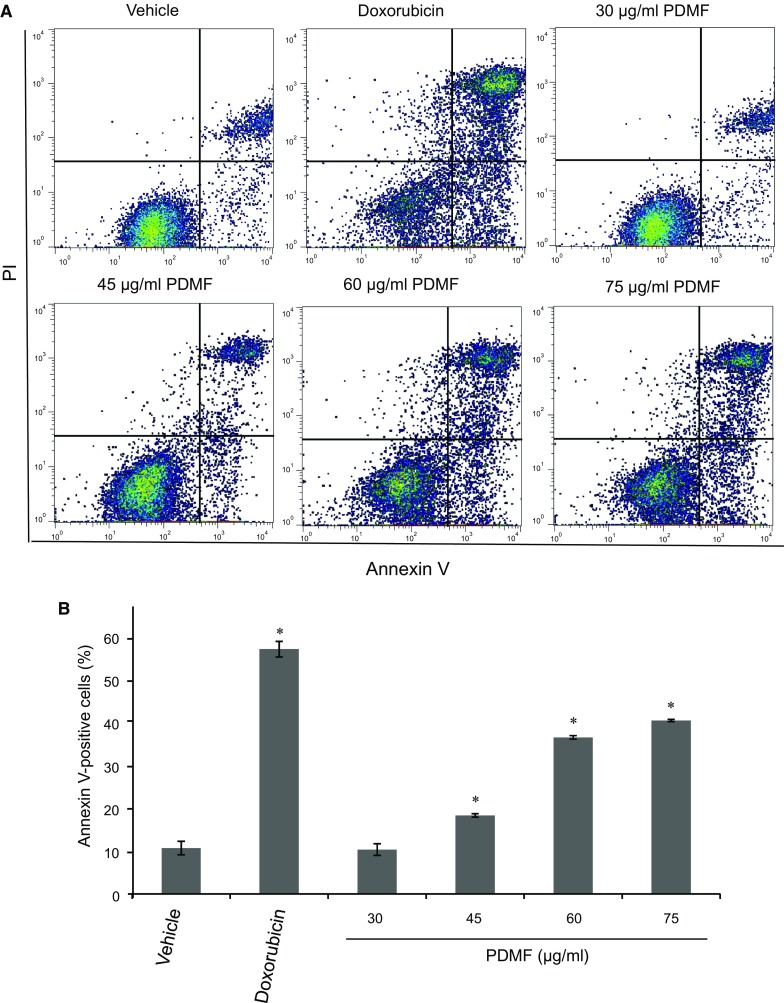
Proapoptotic potency of PDMF on A549 cells. a Representative cytograms of apoptotic A549 cells stimulated with 0 (vehicle), 30, 45, 60 or 75 μg/ml PDMF, or 580 ng/ml doxorubicin as a positive control for 24 h. The lower-right (annexin V+PI− cells) and the upper-right (annexin V+PI+ cells) quadrants show early and late apoptotic cells, and the lower-left (annexin V−PI− cells) and the upper-left (annexin V−PI− cells) quadrants represent viable and necrotic cells, respectively. b Quantification of annexin V-positive apoptotic cells upon stimulation with PDMF. The values are the mean ± SD of three different experiments. * P < 0.05 indicates significant differences compared with vehicle