. 2018 Jun 21;33(2):164–174. doi: 10.3803/EnM.2018.33.2.164

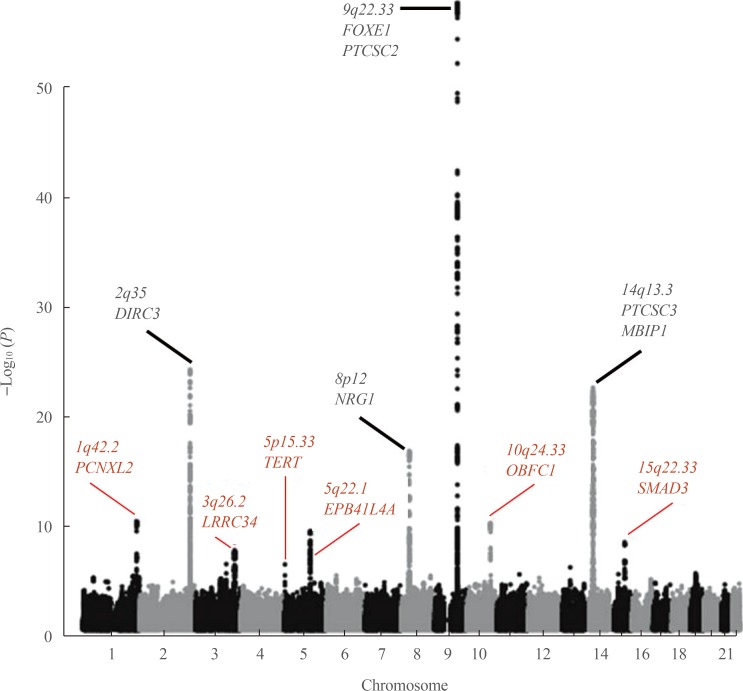
Fig. 1. A Manhattan plot of the combined thyroid cancer genome-wide association study (GWAS) results in the populations of European ancestry according to [24]. The vertical axis is the negative log10-transformed P values for association signals of single-nucleotide polymorphisms across 22 autosomal chromosomes (horizontal axis). Annotated in black color are the loci discovered in earlier studies and replicated by different groups. Red color correspond to six novel loci associated with thyroid cancer detected by meta-analysis of GWAS data from 3,001 patients and 287,550 controls of the European descent. Note that statistical significance of association of the newly detected loci is generally lower than of those discovered earlier. The figure is derived from the open access article [24] according to a Creative Commons Attribution 4.0 International License and is presented here with minor modifications. FOXE1, forkhead box E1; PTCSC2, papillary thyroid carcinoma susceptibility candidate 2; PCNXL2, pecanex homolog 2; DIRC3, disrupted in renal carcinoma 3; LRRC34, leucine rich repeat containing 34; TERT, telomerase reverse transcriptase; EPB41L4A, erythrocyte membrane protein band 4.1 like 4A; NRG1, neuregulin 1; OBFC1, STN1, CST complex subunit; PCNXL3, pecanex homolog 3; MBIP1, MAP3K12 binding inhibitory protein 1; SMAD3, SMAD family member 3.

Fig. 1