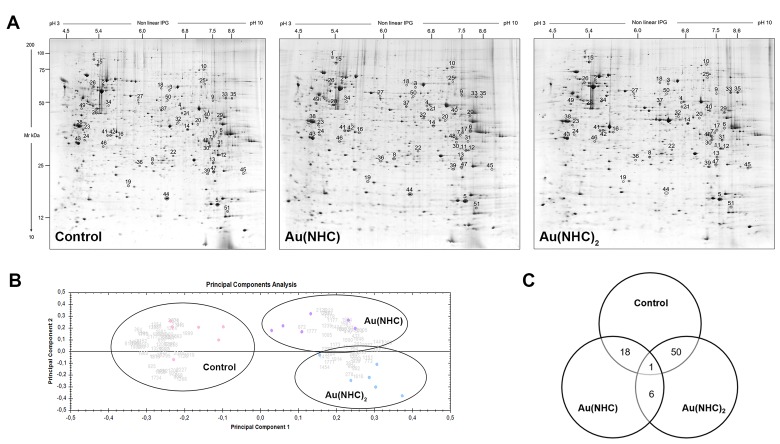
Figure 4. Proteomic profile of Au(NHC) and Au(NHC)2-treated A2780 cells.
(A) Representative colloidal Coomassie blue silver-stained 2-DE gel images for control, Au(NHC) and Au(NHC)2-treated A2780 cells. Proteins (700 μg) were separated by 2-DE using IPG strips with a pH gradient of 3–10 non-linear and 9–16% linear gradient SDS-PAGE, as described in detail in Materials and Methods. Black circles and numbers indicate statistically differentially abundant protein spots, given as in Table 2. (B) Multivariate analysis of the 2-DE gel images results using Principal Components Analysis (PCA) performed by Progenesis SameSpots 4.0 software (Nonlinear Dynamic, UK). (C) Distribution of the differentially abundant protein spots between pairwise comparisons of control cells, Au(NHC)-treated cells and Au(NHC)2-treated cells, as detected by 2-DE analysis.

