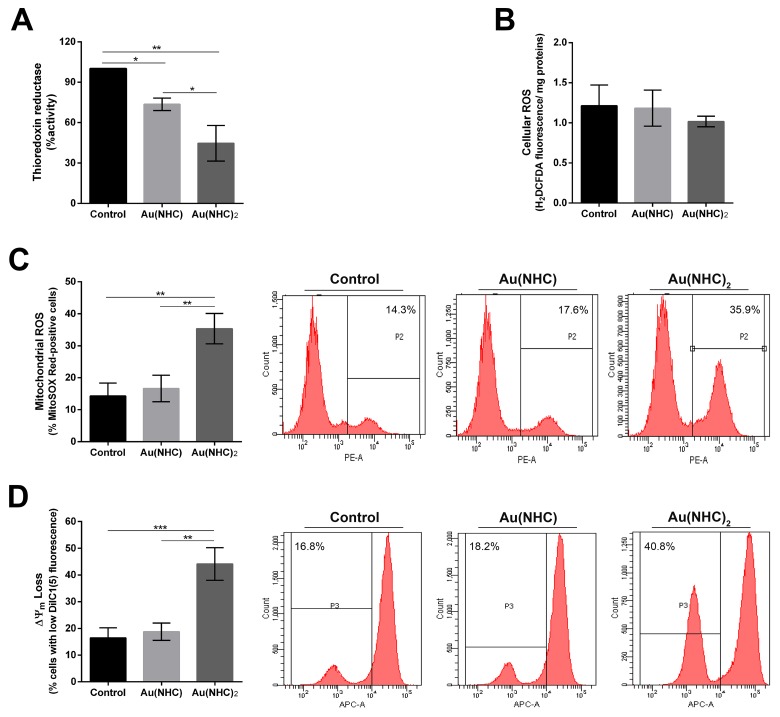
Figure 7. Interference with cellular redox state in A2780 cells.
A2780 cells were treated with Au(NHC) and Au(NHC)2-72 h-IC50-dose. (A) TrxR enzyme inhibition assay was performed after 24 h of treatment using a commercial thioredoxin reductase assay kit (Sigma-Aldrich). (B) Cellular generic ROS production were evaluated after 72 h of treatment by the fluorogenic dye H2DCFDA analysed using a fluorescence spectrophotometer. (C) Mitochondrial superoxide anion production was assessed using the fluorogenic dye MitoSOX Red production by flow cytometry after 72 h of treatment. (D) Mitochondrial membrane potential (Δψm) using the cyanine dye DiIC1(5) and flow cytometry, after 72 h of treatment. Flow cytometric images are representative of three independent experiments. Histograms report the mean values ±SD. The statistical analysis was carried out using one-way ANOVA test followed by Tuckey's multiple comparisons test using Graphpad Prism v 6.0 (*p<0.05, **p<0.01, ***p<0.001).

