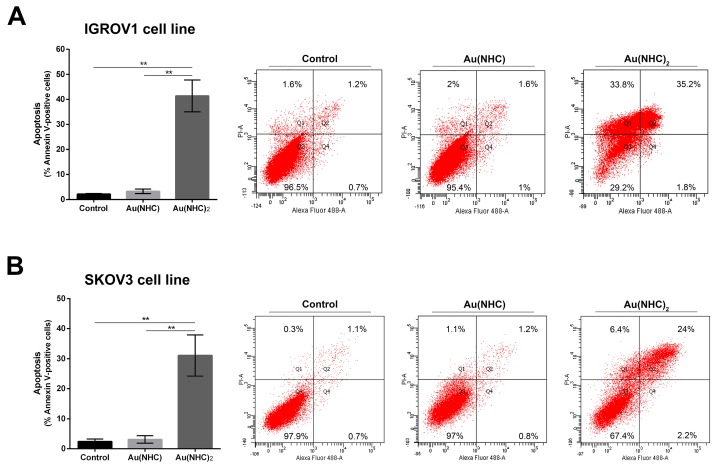
Figure 8. Apoptosis induction in IGROV1 and SKOV3 ovarian cancer cells.
Percentage of apoptotic cells shown by flow cytometry analysis of annexin V/propidium iodide-stained IGROV1 (A) and SKOV3 (B) cells treated for 72 h with Au(NHC) and Au(NHC)2-72 h-exposure IC50-dose. Flow cytometric images are representative of three independent experiments. Histograms report the mean values ±SD. The statistical analysis was carried out using one-way ANOVA test followed by Tuckey's multiple comparisons test using Graphpad Prism v 6.0 (**p<0.01).

