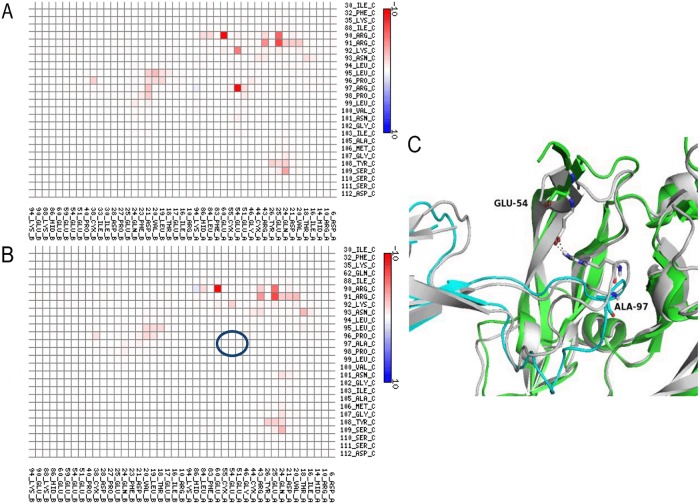
Figure 3. Interaction map for Mutant 2 (Arg97Ala) within the VNAR V13-VEGF165 complex.
Interactions between V13 (vertical axis) and VEGF165 (horizontal axis) are shown for the parental (A) and mutated (B) forms. The color scale is a function of the value of the interaction energy: redder shades indicate more favorable interactions, while bluer tints are less favorable. (C) Representation of the interaction at position 97 of V13 and position 60 of VEGF165 before (white cartoon) and after ( V13 green cartoon and VEGF165 cyan cartoon) mutation. The blue circles show the amino acids that decrease the interaction between the proteins.

