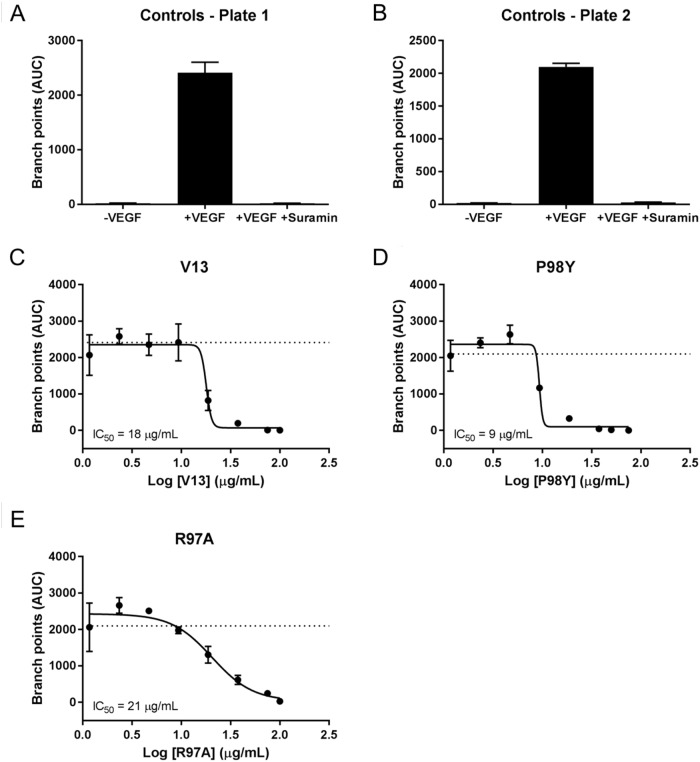
Figure 9. AUC analysis of test effect of VNARs on HUVEC-vessel branching.
AUCs for each time point were calculated for branch points using GraphPad Prism. Curve fitting (A-E) was carried out using nonlinear regression (four parameters), and the average of the +VEGF165 controls is indicated by a dashed line.

