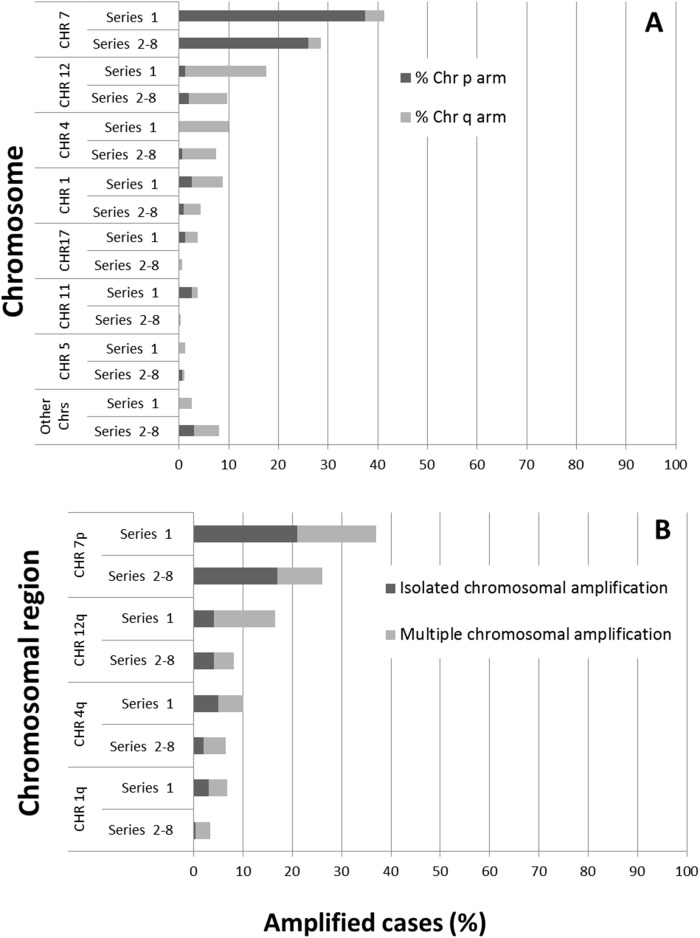
Figure 2.
Distribution of the most frequently altered chromosomes (A) and chromosomal regions (B) showing isolated or multiple amplifications both in cases from series 1 (n=45/80) and in patients (111/267) from the seven distinct series previously reported in the literature by others. Results are shown as percentage values from all cases analyzed.

