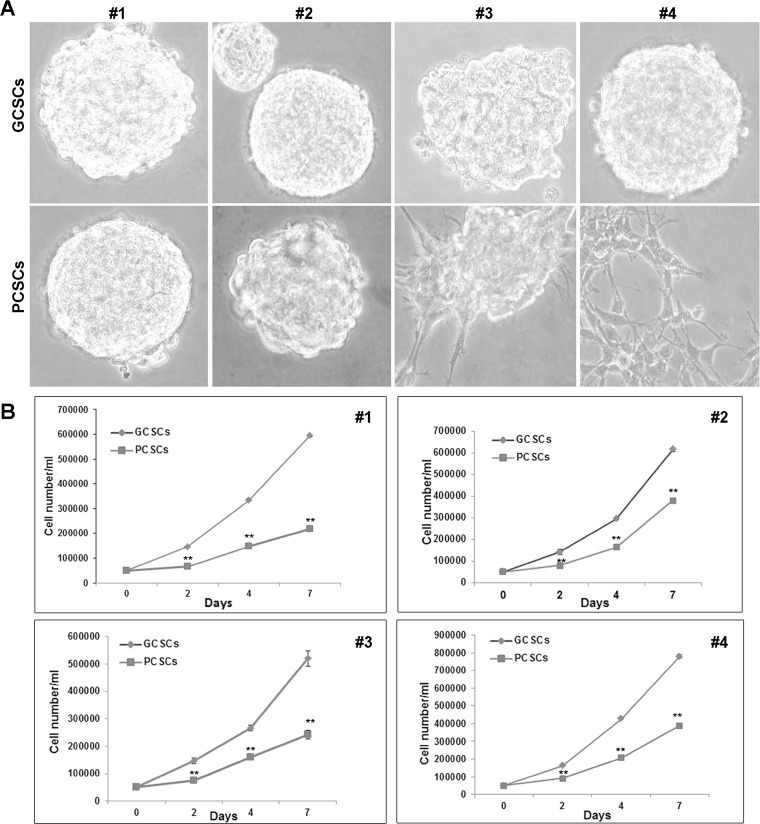
Figure 1. Morphological and proliferation analysis of GCSC/PCSC pairs.
(A) GCSCs derived from all the four patients, as well as PCSCs obtained from patients #1 and #2, grew as floating neurospheres. PCSCs corresponding to patients #3 and #4 grew as semi-adherent cells. Original magnification, ×400. (B) In each GCSC/PCSC pair (#1–4) analyzed, GCSCs (rumble) show a higher proliferation rate if compared to PCSCs (square). Values represent the mean ± SD of three independent experiments. Data were analyzed by Student t test, **p < 0.001 vs GCSCs.

