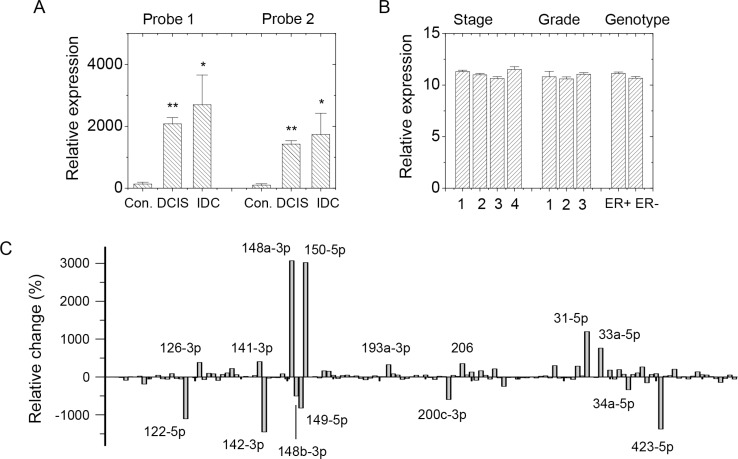
Figure 1. SDC1 and miRNA expression in GEO profile.
(A) SDC1 expression profile in GDS3853 showed increased expression levels in ductal carcinoma in situ (DCIS; n = 9) and invasive ductal carcinoma (IDC; n = 5) comparing with healthy breast tissue (n = 5). Two nucleotide probes against SDC1 were used. (B) SDC1 expression in datasets GDS4056 and GDS4057 showed no significant difference in breast cancer patients at different pre-chemotherapy stages (n = 2, 40, 80, respectively), BMN grades (n = 2, 38, 74, respectively), or ER+/ER– genotypes (n = 84 and 58, respectively). (C) Comparison in relative change of miRNA expressions in normal tissues (n = 5) and malignant tissues (n = 93) using GEO data GSE7842. Data were mean ± S.E. **p < 0.01. *p < 0.05.

