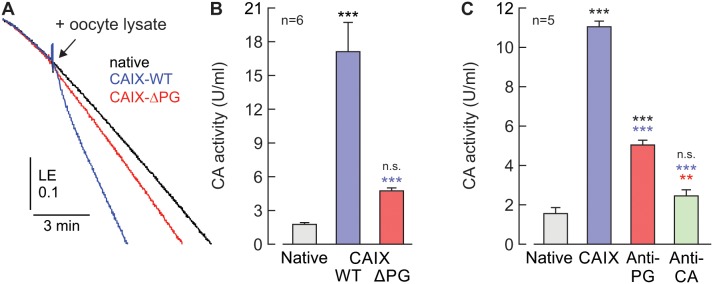
Figure 4. The PG domain of CAIX facilitates catalytic activity in vitro.
(A) Original recordings of the log enrichment (LE), as measured by gas-analysis mass spectrometry, of a pool of 20 lysed, native oocytes (black trace) and pools of 20 lysed oocytes, expressing either CAIX-WT (blue trace) or CAIX-ΔPG (red trace). The beginning of the traces shows the rate of degradation of the 18O-labeled substrate in the non-catalyzed reaction. The black arrowhead indicates addition of oocyte lysate. (B) Enzymatic activity of lysates from 20 native oocytes (gray) and 20 oocytes expressing either CAIX-WT (blue) or CAIX-ΔPG (red), respectively. One unit is defined as 100% stimulation of the non-catalyzed 18O depletion of doubly labelled 13C18O2. Data are represented as mean + SEM. Significance in differences was tested with ANOVA, followed by means comparison. The black significance indicators above the bars from CAIX-expressing oocytes refer to the values from native cells (gray bar). The blue asterisks above the bar from CAIX-ΔPG-expressing oocytes refer to the values from CAIX-WT-expressing oocytes (blue bar). (C) Enzymatic activity of cell lysate from 20 native (gray) and CAIX-expressing oocytes (blue, red and green), respectively. Cell lysates were incubated for 2h with 5 μg/ml of Anti-PG (red), 5 μg/ml of Anti-CA (green), or without antibody (blue). One unit is defined as 100% stimulation of the non-catalyzed 18O depletion of doubly labelled 13C18O2. Data are represented as mean + SEM. Significance in differences was tested with ANOVA, followed by means comparison. The black significance indicators above the bars from CAIX-expressing oocytes refer to the values from native cells (gray bar). The blue asterisks above the bar from CAIX-expressing oocytes, incubated with antibodies refer to the values from CAIX-WT-expressing oocytes without antibody (blue bar). The red asterisks above the bar from CAIX-expressing oocytes, incubated with Anti-CA refer to the values from CAIX-WT-expressing oocytes, incubated with Anti-PG (red bar).

